
Key Takeaways
- Statistical modeling helps you understand relationships in data and make predictions, without needing to test every possible scenario in the real world.
- Different statistical model types serve different goals: regression forecasts outcomes, classification supports decisions, clustering finds patterns, and time series tracks trends over time.
- Statistical modeling is a foundational skill for careers in data science, analytics, research, and any field where evidence-based decisions matter.
- While statistical modeling and machine learning overlap, they differ in focus: statistical models prioritize interpretability and inference, while machine learning prioritizes predictive accuracy.
- You don’t need a math PhD to get started in statistical modeling. A solid understanding of statistics fundamentals, combined with hands-on practice, is enough to begin applying models to real problems.
Every time a hospital predicts which patients might be readmitted, a bank decides whether to approve a loan, or a retailer estimates next quarter’s demand, statistical modeling is working in the background. It’s one of the most practical tools in modern data analysis, and also one of the most misunderstood.
Statistical modeling is about using mathematical structures to represent relationships in data. It helps you test assumptions, explore patterns, and make informed predictions or decisions. It lives at the intersection of statistics, mathematics, and subject-matter expertise, and it’s a foundational skill for anyone who wants to work with data professionally.
This article is for students, analysts, and curious professionals who want a clearer picture of what statistical modeling actually involves and why it matters. We’ll walk through the core definition, look at the most common types of models, explain how statistical modeling differs from machine learning, and outline where to begin if you want to build this skill yourself.
What Is Statistical Modeling?
Statistical modeling is a way of describing real-world phenomena using mathematical relationships. A statistical model takes data as input and produces a structured way of understanding how variables relate to each other, and how those relationships can be used to explain or predict outcomes.
You can’t observe every factor that influences, say, a patient’s recovery time. But if you gather enough relevant data and construct a model around it, you can identify which variables matter most and how they interact.
Every statistical model involves three elements:
- Data: the observed measurements or records you’re working with.
- Variables: the specific factors you’re measuring, some you’re trying to predict (outcomes), others you’re using to make predictions (inputs).
- Assumptions: the rules the model follows about how data behaves. Different models make different assumptions, which is why choosing the right model for your data matters.
Statistical modeling isn’t about finding perfect answers, but rather making the best possible inferences from imperfect, real-world data.
Why Is Statistical Modeling Important?
Statistical modeling is what turns raw numbers into insights you can act on. Across industries, organizations face questions they can’t answer through intuition or simple observation alone. Should this drug move to clinical trials? Will this customer churn next month? What’s the projected demand for this product in Q3? Statistical modeling provides a structured, evidence-based way to approach those questions.
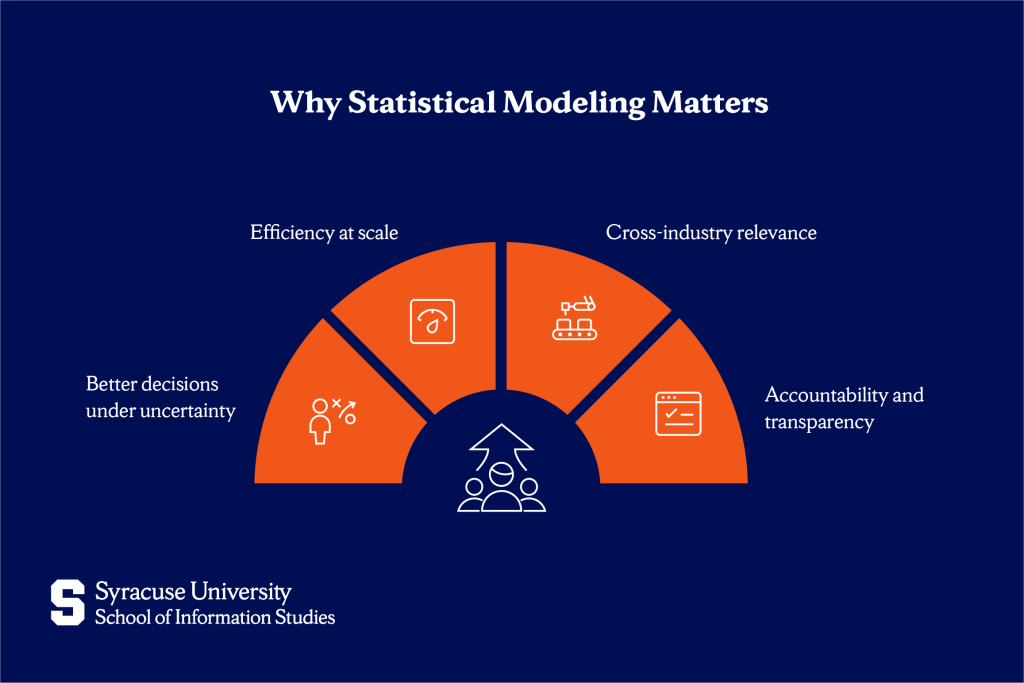
Better decisions under uncertainty
Models don’t eliminate uncertainty; they quantify it. That’s what makes them valuable. Decision-makers can see not just a predicted outcome, but how confident the model is in that prediction.
Efficiency at scale
Statistical models can process far more data than any human analyst could manually review. They examine large volumes of information quickly and consistently. This makes it possible to identify patterns across thousands of variables at the same time.
Cross-industry relevance
Statistical modeling plays a central role in many professional fields. It supports decision-making in areas such as public health policy, financial risk management, and product development. In nearly every industry, data-driven work relies on statistical models to guide evidence-based choices.
Accountability and transparency
A well-built statistical model can be clearly explained and reviewed. Its assumptions, inputs, and outputs can be examined step by step. This level of transparency is especially important in regulated industries such as healthcare and finance.
Reasons to Learn Statistical Modeling
Understanding statistical modeling isn’t just useful, but also increasingly expected in data-facing roles.
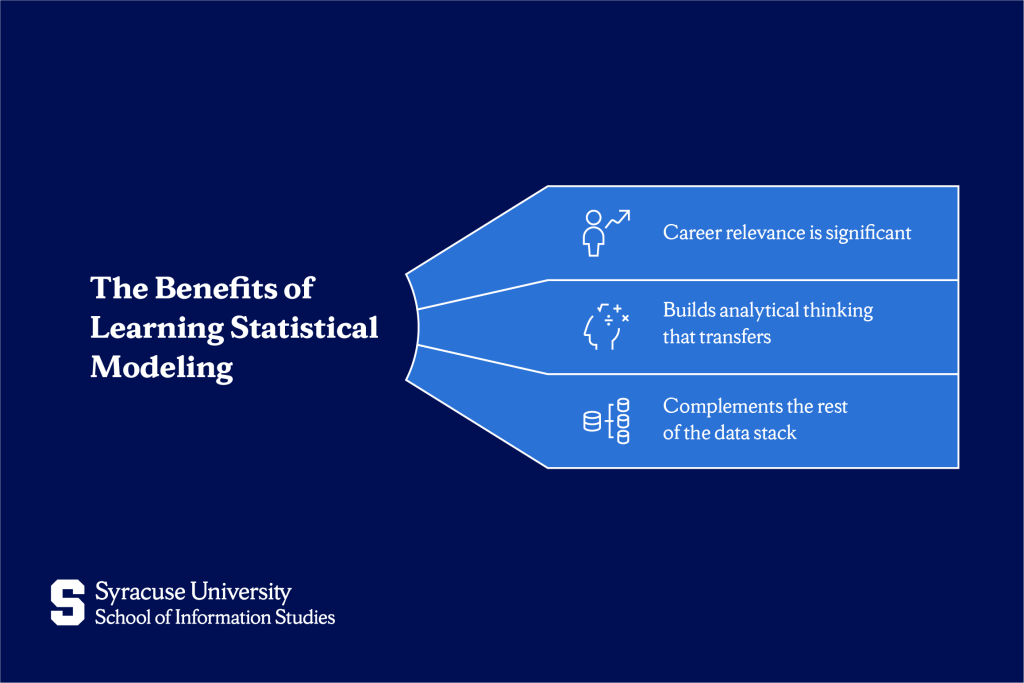
Career relevance is significant
Roles in analytics, research, business intelligence, and data science all require some level of statistical reasoning. Employers aren’t just looking for people who can run software; they want analysts who understand what their models are actually doing and can explain results to non-technical stakeholders. Reviewing the core data scientist skills makes clear how central statistical thinking is to the profession.
Builds analytical thinking that transfers
Learning statistical modeling changes how you approach problems. You start asking better questions about data, looking for confounding variables, and questioning assumptions. That mindset is valuable well beyond any specific tool or technique.
Complements the rest of the data stack
Statistical modeling works closely with data science, machine learning, and data visualization. It helps you understand why algorithms behave the way they do and how to interpret their outputs correctly. It also strengthens your ability to communicate results clearly so they support better decisions.
Types of Statistical Models
The right statistical model depends on what you’re trying to learn from your data, whether that’s predicting a number, making a classification, finding hidden groups, or tracking patterns over time.
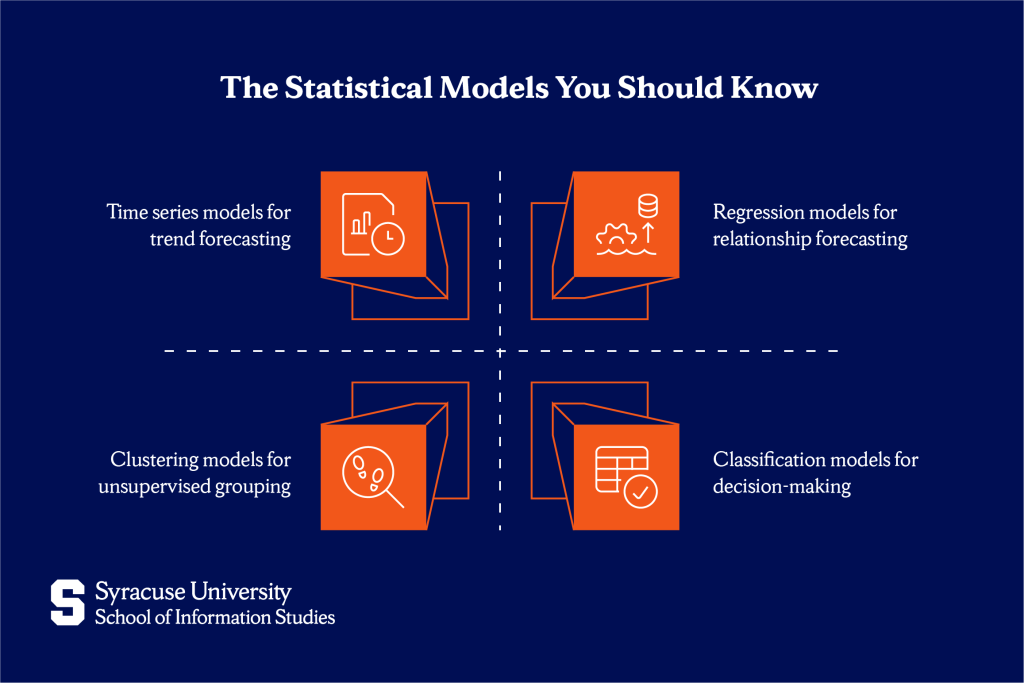
Regression models for relationship forecasting
Regression models are used when you want to predict a continuous outcome, a number, based on one or more input variables. They answer questions like: How much will sales change if we increase our ad spend by 10%? What’s the expected salary for someone with five years of experience in this field?
In a regression model, you have a dependent variable (the outcome you’re predicting) and one or more independent variables (the factors you’re using to make that prediction). The model estimates the strength and direction of the relationship between them.
Common use cases include price forecasting, trend estimation, and impact analysis; essentially any situation where you need to understand how one thing affects another.
Classification models for decision-making
Classification models are used when the outcome you’re predicting falls into categories rather than a continuous range. The question isn’t “how much?” but “which one?”
These models power some of the most familiar applications in data science: email spam filters (spam or not spam), medical diagnosis tools (disease present or absent), and credit approval systems (approved or declined). They can handle binary decisions (two outcomes) or multi-class decisions (three or more).
What makes classification models particularly powerful is their ability to weigh multiple inputs simultaneously and output a probability.
Clustering models for unsupervised grouping
Clustering is different from regression and classification: there’s no predefined outcome to predict. Instead, the model looks for natural groupings in data on its own. This is what “unsupervised” means; you’re not telling the model what to look for, you’re letting the patterns emerge from the data.
Clustering is especially useful in the early stages of analysis, when you’re trying to understand the structure of your data before building more targeted models. Common applications include customer segmentation (grouping customers by behavior without knowing the groups in advance), document categorization, and anomaly detection.
Time series models for trend forecasting
Time series models are built for data collected sequentially over time, like daily sales figures, monthly website traffic, or hourly energy consumption. The sequential nature of this data means that what happened yesterday is relevant to what happens today, and models need to account for that dependency.
These models identify patterns like trends (long-term direction), seasonality (recurring cycles), and noise (random variation). Forecasting applications are widespread: demand planning, financial projections, inventory management, and epidemiological modeling all rely on time series techniques.
How to Get Started With Statistical Modeling
Statistical modeling is learnable, even if you’re starting with no prior experience. The important part is building strong basics first and understanding the concepts before using the tools:
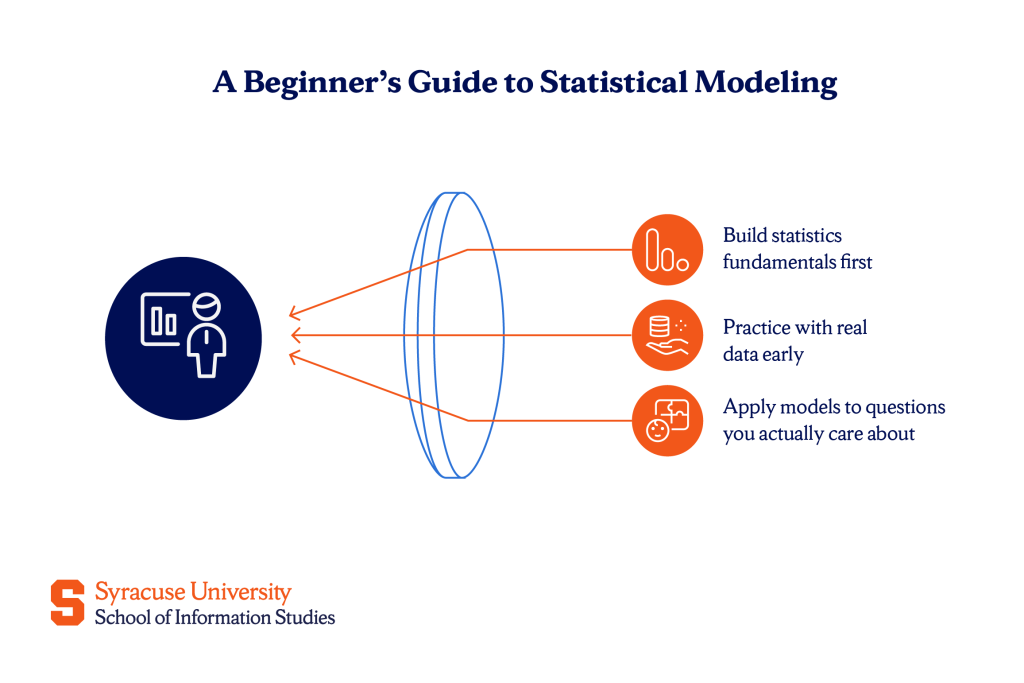
- Build statistics fundamentals first: Before touching software, make sure you’re comfortable with concepts like probability, distributions, hypothesis testing, and correlation.
- Practice with real data early: Theory makes much more sense when it’s grounded in something concrete. Free datasets on Kaggle and the UCI Machine Learning Repository give you plenty of material to experiment with.
- Apply models to questions you actually care about: The most effective learning happens when you’re trying to answer a question that matters to you, whether that’s studying a social trend or working on a class project.
Skills required for statistical modeling
Strong statistical modeling isn’t just about technical ability. The practitioners who do it well combine both:
Technical skills:
- Statistics fundamentals (probability, distributions, significance testing)
- Understanding of model assumptions and how to check them
- Data interpretation (reading outputs, not just generating them)
- Comfort with data wrangling and cleaning, since models are only as good as the data going in
Non-technical skills:
- Critical thinking: questioning whether a model’s assumptions hold in your specific context
- Communication: translating statistical findings into plain language for non-technical audiences
- Domain knowledge: understanding the field well enough to know whether a model’s outputs make sense
Tools and software for statistical modeling
The most widely used environments are:
- Python: flexible, open-source, and the dominant language in data science. Libraries like StatsModels and SciPy handle statistical modeling, while Pandas handles data preparation.
- R: purpose-built for statistical analysis and still the preferred tool in academic research and fields like epidemiology, economics, and psychology. It has an extensive library of statistical packages.
- Excel and Google Sheets: appropriate for simpler analyses and widely accessible; a good starting point before moving to more advanced tools.
- SPSS and SAS: used heavily in social science research and enterprise environments, particularly in healthcare and government.
The best tool is the one used in your industry or program. If you’re studying Applied Data Science, Python will serve you well across coursework and career applications alike.
Statistical Modeling vs. Machine Learning
These two fields are closely related and also frequently confused. Here’s how they actually differ:
| Statistical Modeling | Machine Learning | |
| Primary goal | Inference and understanding | Prediction and classification |
| Interpretability | High, models are explainable | Often lower, especially deep learning |
| Data requirements | Works well with smaller, structured datasets | Typically requires large amounts of data |
| Assumptions | Explicit: you define them upfront | Minimal: the algorithm learns from data |
| Typical use | Research, policy, risk analysis | Recommendation systems, image recognition, NLP |
The distinction isn’t about which is better, but which is appropriate. A clinical researcher trying to understand the relationship between a drug dosage and patient outcomes needs a statistical model because interpretability and valid inference matter. A company building a recommendation engine for millions of products might prioritize predictive accuracy and lean on machine learning instead.
In practice, many data professionals use both statistical models to understand data and test hypotheses and machine learning to scale predictions.
Use Cases of Statistical Modeling
Statistical modeling isn’t abstract. Here’s how it’s applied across three major industries:
- Healthcare: Hospitals use logistic regression models to predict patient readmission risk, flagging high-risk patients before discharge so care teams can intervene. Epidemiologists use time series models to forecast disease spread, which was critical during the COVID-19 pandemic for resource planning and policy decisions.
- Finance: Banks and lenders use classification models to score credit risk, weighing factors like income, payment history, and debt-to-income ratio to decide whether to approve a loan and at what interest rate. Risk analysts use regression models to estimate exposure under different market scenarios.
- Marketing: A/B testing (comparing two versions of a campaign or product feature to see which performs better) is a direct application of statistical hypothesis testing. Customer segmentation uses clustering models to group buyers by behavior, enabling more targeted messaging and resource allocation.
Moving Forward With Statistical Modeling
Statistical modeling is one of the most transferable skills in modern data work. You now know what it is (a structured way of representing relationships in data), why it matters, and the four main model types you’ll encounter in practice: regression, classification, clustering, and time series.
From here, the focus shifts to applying what you’ve learned. Pick a dataset on a topic you’re curious about, choose a model type that fits the question you’re asking, and work through the full process, from cleaning the data to interpreting the output. From there, you can go deeper: explore more advanced modeling techniques, learn how statistical approaches complement machine learning pipelines, or specialize in an industry application like healthcare analytics or financial risk modeling.
If you want a structured path that takes you from foundations to professional-level application, Syracuse University iSchool’s Applied Data Science Bachelor’s Degree builds these skills alongside real project experience, faculty mentorship, and a career-focused curriculum.
Explore the Applied Data Science program to see how you can begin building these capabilities in a focused and supported environment.
Frequently Asked Questions (FAQs)
When should statistical modeling be used instead of simple descriptive analysis?
Use statistical modeling when you need to make predictions, test a hypothesis, or understand how one variable influences another. If you’re simply summarizing data for a report, descriptive analysis is often enough. If you’re informing a decision or building something predictive, you need a model.
Is statistical modeling still relevant with the rise of machine learning?
Yes. Statistical modeling and machine learning serve different but complementary purposes. Machine learning is strong at finding patterns and making predictions from large datasets, while statistical modeling focuses on explaining relationships and making results interpretable. Statistical modeling also provides the foundation needed to critically assess machine learning outputs.
Can beginners apply statistical modeling to real-world problems?
Of course. You don’t need advanced mathematics to start. Linear regression, one of the most widely used statistical models, can be applied with a basic understanding of variables and correlation. Platforms like Kaggle offer free datasets and guided projects specifically designed for beginners. The most important thing is starting with a clear question, choosing a model that fits that question, and taking time to understand what the output is actually telling you.