
Key Takeaways
- Technical foundation matters: Python, SQL, and statistics are non-negotiable for entry-level data science roles.
- Soft skills separate good data scientists from great ones: Business acumen and communication turn insights into action.
- Learning is continuous: Tools and methods change rapidly, so staying current is part of being a data scientist.
Data science roles are growing faster than almost any other career path in tech. According to the U.S. Bureau of Labor Statistics, data scientist positions are projected to grow 34% over the decade, much faster than the average for all occupations. What’s driving this demand? Organizations across every industry need professionals who can turn massive datasets into strategic decisions.
But here’s what job postings won’t always tell you: becoming an effective data scientist requires more than just knowing how to code. You need a combination of technical depth and analytical thinking, plus the ability to translate complex findings into business language that non-technical stakeholders can act on.
If you’re mapping your learning path or considering a career shift, here are 12 essential data science skills you’ll need to break into the field and succeed!
Technical, Analytical & Soft Skills Every Data Scientist Needs
You need more than technical proficiency for a successful career in data science. The most effective data scientists combine coding and mathematical skills with business thinking and clear communication.

Python and/or R programming
Coding fluency is the foundation for nearly all data science work. Python dominates the data science landscape because of its readability and extensive ecosystem. You’ll use libraries like Pandas for data manipulation, NumPy for numerical operations, and Scikit-learn for machine learning. These tools let you clean datasets, engineer features, and build models without starting from scratch.
R remains popular in academic and statistical settings, particularly for its Tidyverse ecosystem. Packages like dplyr and ggplot2 make data manipulation and visualization intuitive. If you’re working in research or biostatistics, R may be your primary language.
Most data scientists choose one language to start, then pick up the other as needed. Python’s broader application in machine learning and web development makes it the more common first choice.
SQL and databases
Even with modern tools, SQL remains the standard language for working with structured data. Most organizational data (customer records, sales transactions, user behavior logs) lives in relational databases. SQL allows you to pull exactly the data you need from systems such as PostgreSQL, MySQL, or cloud platforms like Amazon Redshift, all of which use similar syntax.
Mastering JOINs is especially important. Real-world analysis almost always involves combining multiple tables: linking customer profiles with purchase records, connecting transactions to product details, or merging demographic data with behavior patterns. For instance, a LEFT JOIN keeps all records from the main table while adding related data from another, which is helpful when you want every customer included, even those without purchases.
Job postings consistently list SQL as a requirement, typically appearing in data science roles. Proficiency here signals you can work with production data, not just cleaned datasets from tutorials.
Data wrangling & preprocessing
Preparing data is where most of your effort actually goes. Unprepared data is messy. You’ll encounter missing values, inconsistent formats, duplicate records, and outliers that skew your results. The process of transforming this chaos into a clean dataset ready for analysis is called data wrangling.
Preprocessing goes one step further. Once data is cleaned, preprocessing standardizes and transforms it into a form that machine learning algorithms can interpret. This includes normalizing numerical values, scaling features to a common range, splitting data into training and testing sets, and handling categorical variables in ways that preserve relationships among features.
These steps directly affect model accuracy. Even the most advanced algorithm can produce poor results if trained on unclean or inconsistent data. In most projects, data preparation takes far more time than model training, but it’s what ensures the model reflects reality and delivers trustworthy insights.
The goal is to create a dataset that accurately represents the problem you’re trying to solve.
Data visualization & BI tools
Turning cleaned data into insights requires strong visualization and business intelligence capabilities.
You’ll use two main types of tools. Programming libraries such as Matplotlib and Seaborn in Python offer detailed control for exploring data visually. You might create many plots while looking for patterns: scatter plots to test correlations, histograms to view distributions, or time series charts to track trends over time.
Business intelligence platforms like Tableau and Power BI serve a different purpose: building interactive dashboards for non-technical stakeholders. These tools let business users filter data, drill into details, and track metrics without writing code. A sales director checking regional performance or a marketing manager monitoring campaign results will use these dashboards daily.
Knowing when to use each matters. Use Python libraries when exploring data for yourself. Build BI dashboards when stakeholders need ongoing access to metrics. The best data scientists master both, choosing the right tool for each audience.
Statistics and probability
Understanding statistics and probability gives you the analytical foundation behind machine learning algorithms.
Statistics isn’t an abstract theory, but it’s how you determine whether findings are real or random chance. Consider an A/B test for a website button color. You show half your visitors the current button and half a new design. The new version gets more clicks, but is the difference meaningful or just a random variation?
Here’s the process:
- Define hypothesis: The new button performs differently from the current button.
- Collect data: Track clicks and impressions for both versions.
- Compute significance: Use a statistical test to calculate if the difference is likely real.
- Make a decision: Implement the change only if the results are statistically significant.
This same logic applies across data science. You’ll use probability distributions to model uncertainty, confidence intervals to express the range of likely outcomes, and hypothesis testing to validate findings before recommending business decisions.
You don’t need a statistics PhD, but you should understand these fundamentals well enough to recognize when results are trustworthy versus when you need more data.
Linear algebra and calculus
Behind every machine learning algorithm lie linear algebra and calculus: the mathematics of data science.
Linear algebra is the math of vectors and matrices, which you can think of as the spreadsheet math underlying data science. When you represent a dataset with thousands of customers and dozens of features, you’re working with matrices. Operations like dimensionality reduction (PCA) or recommendation systems depend on matrix manipulations.
Calculus, particularly gradient descent, powers the optimization at the heart of machine learning. When training a model, algorithms adjust parameters repeatedly to minimize prediction error. Gradient descent uses calculus to determine which direction improves the model fastest.
Grasping these concepts helps you understand model behavior. Why does a neural network need many iterations to train? Gradient descent. Why can we reduce 50 features to 10 principal components? Linear algebra.
These fundamentals separate data scientists who can troubleshoot model issues from those who only know which buttons to click.
Supervised and unsupervised learning
Modeling is where data science starts to deliver real business value.
Supervised learning trains models on labeled data (datasets where you already know the right answer). Your algorithm learns patterns that connect input features to outcomes. Common applications include:
- Classification: Predicting categories. Will this customer stop using our service? (Yes/No). Logistic regression is a standard starting algorithm.
- Regression: Predicting continuous numbers. What will next quarter’s sales be? Linear regression or gradient boosting models are typical choices.
Unsupervised learning finds patterns in data without predefined labels. The algorithm identifies structure on its own. Key uses include:
- Customer segmentation: Grouping customers by behavior patterns using K-Means clustering. Marketing can then tailor campaigns to each segment.
- Anomaly detection: Flagging unusual patterns that might indicate fraud. Isolation Forest algorithms excel at spotting outliers in transaction data.
When do you use each? If you have labeled training data and need to predict specific outcomes, use supervised learning. If you want to find natural groupings or detect unusual patterns without predefined categories, use unsupervised methods. Understanding both approaches lets you match techniques to business problems effectively.
Deep learning frameworks (e.g., TensorFlow, PyTorch)
For problems like image recognition or complex text analysis, deep learning frameworks take you further than traditional machine learning.
Deep learning uses neural networks with many layers to process unstructured data (images, text, audio) that simpler algorithms struggle with. If you’re building a system to diagnose medical images, analyze customer reviews at scale, or create recommendation engines, deep learning often outperforms traditional methods.
Frameworks like TensorFlow and PyTorch provide the building blocks. Instead of coding neural networks from scratch, you define your architecture and let the framework handle the complex mathematics and optimization.
These skills typically matter more for specialized or senior roles. Entry-level positions focus on traditional machine learning, but as you advance, you’ll encounter projects where deep learning is the right tool. Understanding the fundamentals (when deep learning adds value versus when simpler models suffice) makes you a better data scientist regardless of your specialization.
Cloud computing (AWS, Azure, GCP)
Most data science now happens in the cloud, so developing cloud skills has become essential.
Local computers can’t handle datasets with millions of rows or models that take days to train. Cloud platforms provide the computing power, storage, and deployment tools that production data science requires.
Here’s a typical workflow on Amazon Web Services (AWS):
- Store data: Upload large datasets to Amazon S3 (cloud storage).
- Process and train: Spin up powerful EC2 instances (virtual servers) to run computationally intensive jobs.
- Deploy models: Use SageMaker to put trained models into production, where applications can access predictions.
Azure and Google Cloud Platform offer equivalent services with slightly different names and interfaces. All three dominate the market, so learning one makes picking up the others easier.
U.S. job postings increasingly list cloud experience, with AWS appearing most frequently. Even if you’re not a cloud engineer, understanding how to leverage these platforms for data work makes you more valuable.
Business acumen
Technical skills alone aren’t enough to make an impact; you also need to understand the business context that gives your analysis meaning.
Here’s a scenario: Your manager asks for a sales forecast. The data scientist with business acumen asks follow-up questions: What decisions will this forecast drive? Are you planning inventory, setting budgets, or staffing stores? How accurate does it need to be? Is being within 5% good enough, or do you need tighter precision?
These questions guide how the technical work unfolds. A forecast for long-term financial planning might rely on monthly data and straightforward methods, while one designed to prevent stockouts demands daily precision and advanced models that factor in promotions, holidays, and regional variations.
Business acumen means understanding:
- Which metrics matter: Revenue growth, customer lifetime value, and churn rate often matter more than model accuracy metrics.
- How decisions get made: Stakeholders won’t adopt recommendations they don’t trust or understand.
- What constraints exist: You might have perfect data for a three-month project, but leadership needs results in two weeks.
The best data scientists think like business partners, not just technical specialists.
Communication & storytelling with data
Being able to translate numbers into narrative is what separates a good data scientist from a great one.
Technical results mean nothing if stakeholders can’t understand them. Telling a stakeholder “the model’s F1-score is 0.85” is accurate but unhelpful. Translating it to business impact works better: “We can correctly identify 85% of at-risk customers, letting us intervene before they cancel and potentially save $200K in annual revenue.”
Effective communication includes:
- Visualizations that clarify: A well-designed chart reveals patterns instantly. A poor one confuses or misleads.
- Plain language summaries: Replace technical jargon with clear explanations. “Feature engineering” becomes “we combined existing data in new ways to improve predictions.”
- Executive dashboards: C-suite leaders want metrics they can track monthly, not technical deep dives.
Practice this skill deliberately. After finishing the analysis, draft a one-paragraph summary for someone without a data science background. If you can’t explain your work clearly, you haven’t fully understood it yourself.
Strong communication translates insights into action, giving your technical skills real value within the organization.
Problem-solving & critical thinking
Data science is detective work. When model performance falls short, you need to investigate why.
This means being a “data detective”: Your model predicts customer churn with 60% accuracy, but you expected better. You ask:
- Is the data quality poor? Missing values, incorrect labels, or outdated information can hurt performance.
- Did I pick the wrong algorithm? Maybe a neural network isn’t necessary; a decision tree might work better.
- Are the features not representative? Perhaps purchase frequency matters more than the variables you included.
Problem-solving requires curiosity and iterative thinking. You form hypotheses, test them, adjust your approach, and repeat. You combine domain knowledge with technical skills to uncover what’s really happening in the data.
This mindset extends beyond modeling. When stakeholders request analysis that data can’t support, you propose alternatives. When contradictory results appear, you investigate the root cause instead of reporting numbers at face value.
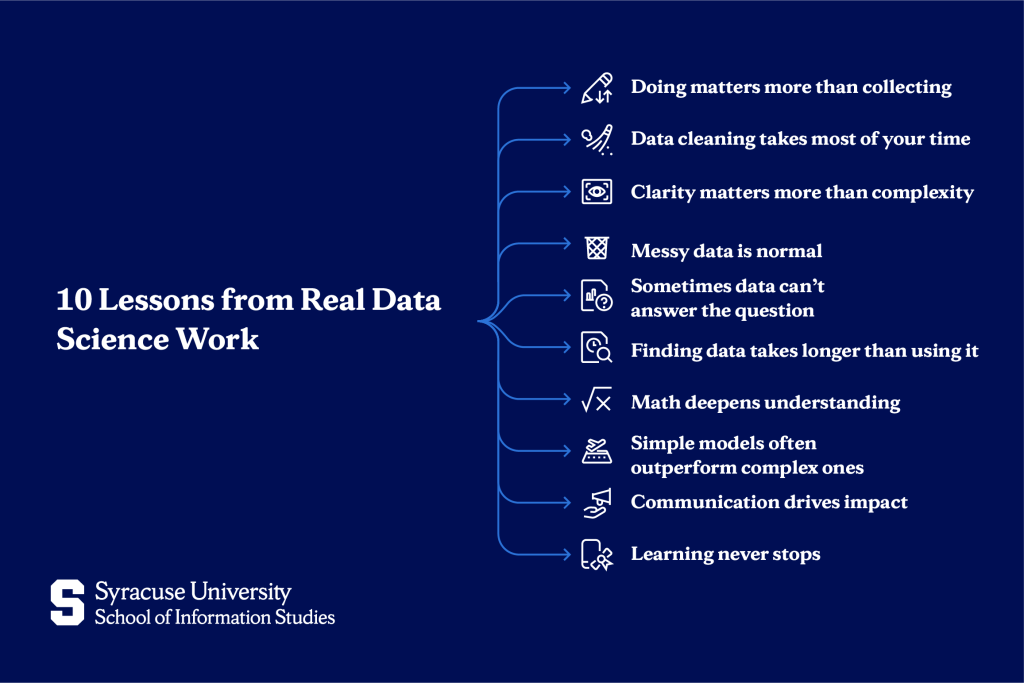
10 Hard-Won Data Science Lessons
While the skills above provide your foundation, these lessons reflect real-world experience that textbooks rarely teach. They come from data scientists who’ve spent years navigating actual business problems, messy data, and organizational dynamics:
1. Collecting resources isn’t learning; you only get better by doing
Bookmarking courses and articles feels productive, but knowledge comes from application. Build projects, make mistakes, and solve real problems.
2. Most of your time will be spent cleaning data, not modeling
Data scientists spend most of their time on data preparation. Get comfortable with this reality; it’s where the actual work happens.
3. Explaining results to non-technical people is a skill you must actively develop
Your manager won’t care about your algorithm’s mathematical elegance. They care about what it means for revenue, costs, or customer satisfaction. Practice translating technical work into business impact.
4. Messy CSVs and broken imports will haunt you more than you expect
Real data is never clean. Files have encoding issues, unexpected formats, and columns that change meaning halfway through. Build patience and troubleshooting skills.
5. Not every question can be answered with the data you have, and that’s okay
Sometimes the honest answer is “we don’t have enough data to make this decision confidently.” Knowing when to push back shows maturity.
6. You’ll spend more time finding and preparing data than analyzing it
Identifying the right data sources, getting access permissions, and understanding what each field actually represents often takes longer than the analysis itself.
7. Math matters if you want to truly understand how models work
You can use machine learning libraries without deep math knowledge, but understanding the underlying mathematics helps you diagnose problems and optimize performance.
8. Simple models often beat complex ones in real-world business problems
A well-tuned logistic regression frequently outperforms a poorly tuned neural network. Start simple, establish a baseline, and add complexity only when necessary.
9. Communication and storytelling skills will often make or break your impact
A mediocre model explained brilliantly creates more business value than a perfect model that sits unused because nobody understands it.
10. Your learning never “finishes” because the tools and methods will keep changing
New libraries, techniques, and best practices emerge constantly. Continuous learning isn’t optional, but it’s part of what defines a data science career.
How to Actively Build and Showcase Your Data Science Skills
Understanding what skills you need is step one. Actually building and proving these skills requires deliberate action. Here’s your roadmap.
Build a portfolio of projects
A strong portfolio demonstrates your abilities better than any resume bullet point. Each project should tell a complete story: what business problem you solved, what data you used, how you approached it, and what results you achieved.
Structure each project repository with:
- Clear README file: Explain the problem, your approach, and key findings in plain language.
- Business context: Why does this problem matter? What decisions would these insights inform?
- Data source: Document where data came from (public dataset, simulated, scraped).
- Methodology: Walk through your process (cleaning, exploration, modeling, validation).
- Results and conclusion: What did you learn? What would you recommend?
Aim for 2-3 diverse projects:
- Regression project: Predict something continuous (housing prices, sales figures, energy consumption).
- Classification project: Predict categories (customer churn, loan defaults, email spam).
- Visualization dashboard: Build an interactive dashboard using Tableau or Plotly that lets users explore data.
Post projects on GitHub with clean code and documentation. Employers reviewing your work will judge both your technical skills and your ability to communicate clearly.
Craft a data-driven resume
Your resume should quantify impact, not just list tasks you performed. Numbers make your contributions concrete.
Before and after examples:
- Before: “Worked on customer churn project.”
After: “Engineered 10+ features and developed a Gradient Boosting model that predicted customer churn with 88% accuracy, identifying $50K in potential monthly revenue savings.”
- Before: “Analyzed sales data.”
After: “Built SQL queries to analyze 2M+ transaction records, revealing that 35% of revenue came from 8% of customers: an insight that guided a redesign of the loyalty program.”
- Before: “Created visualizations for stakeholders.”
After: “Designed executive dashboard in Tableau tracking five KPIs, used by C-suite weekly to monitor 15% revenue growth initiative.”
Every bullet point should answer: What did you do? How did you do it (tools/methods)? What was the impact (numbers)?
Compete and collaborate (Kaggle & open source)
Real growth comes from working with others and seeing how experienced practitioners approach problems.
Kaggle competitions provide structured practice with real datasets. Even if you don’t win, you learn by:
- Reading top competitors’ notebooks to see their approaches.
- Comparing your methods against proven techniques.
- Getting feedback from the community on your submissions.
Start with beginner-friendly competitions. Focus on learning, not winning. Many data scientists improve faster by studying five winning solutions than by completing five courses.
Open source contributions build credibility and give back to the community. You don’t need to contribute major features; small improvements help:
- Fix documentation errors in libraries like Pandas or Scikit-learn.
- Add examples to clarify confusing sections.
- Submit bug reports with clear reproduction steps.
These contributions appear on your GitHub profile and show you’re engaged with the data science community. They also force you to read professional codebases, which improves your own coding significantly.
Closing Thoughts on Data Science Skills
Data science combines technical depth with analytical thinking and business communication. The 12 skills covered, including Python programming, SQL, machine learning, and storytelling, give you the complete foundation employers look for.
But skills alone won’t guarantee success. The 10 lessons from experienced data scientists highlight what makes the difference: practical problem-solving, continuous learning, and the ability to turn insights into action. You now have both the skill roadmap and the real-world wisdom to guide your development.
Start today by choosing one technical skill to practice and one business-focused habit to develop. Build a small project this month. Write a blog post explaining what you learned. Join a Kaggle competition and study how others approached the problem.
To turn data science skills into a career, explore Syracuse University’s iSchool programs in applied data science, including the Applied Data Science Master’s Degree, Applied Data Science Bachelor’s Degree, Applied Data Science Minor, and the Certificate of Advanced Study (CAS) in Data Science. These programs combine hands-on learning with guidance from expert faculty and connect you to a strong network of professionals making a real impact in the field.
Frequently Asked Questions (FAQs)
What is the most underrated skill in data science?
Communication and storytelling with data. Many technically strong data scientists struggle to translate findings into business language that drives decisions. This skill often determines whether your work creates impact or sits unused.
What technical skills should young data scientists focus on?
Start with Python, SQL, and statistics, as these appear in nearly every job posting. Once comfortable, add machine learning fundamentals and one visualization tool (Tableau or Power BI). Build projects that combine these skills to prove you can apply them together.
How important are soft skills in data science roles?
Extremely important. Business acumen, communication, and problem-solving often matter more than advanced algorithms. Employers need data scientists who can identify valuable problems, explain technical work clearly, and collaborate across teams; not just run models.
Can simpler models be better than advanced models?
Yes, frequently. In production environments, a well-tuned logistic regression or decision tree often beats a complex neural network. Simpler models are easier to explain, faster to train, and less prone to overfitting. Always start simple and add complexity only when necessary.