Key Takeaways
- Predictive analytics focuses on using data to predict future events and trends.
- Data collection, data processing, and the algorithms used to build predictive models are key components of predictive analytics.
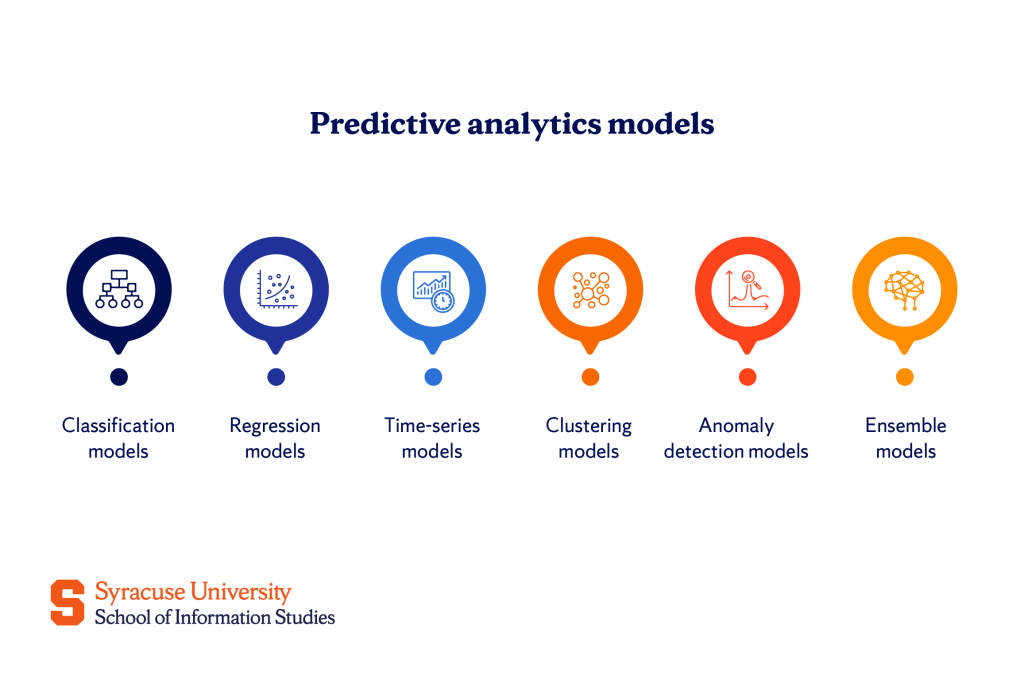
- The main types of models used in predictive analytics are classification, regression, time-series, and clustering models.
When people make predictions, there’s usually reasoning behind them. For example, you might leave early for an appointment because you know traffic tends to build up on that specific route, and you suspect that if you don’t, you’ll run late. Or, pick the team that’s on a winning streak when having a friendly bet on a football game.
In both situations, you’re relying on past experiences and knowledge to help you predict what’s likely to happen next. This is what data scientists do with predictive analytics, only on a much bigger scale.
What Is Predictive Analytics?
Predictive analytics is a discipline of data science, but it is also a distinct field in its own right. It’s focused on using historical and current data to make predictions about future events and involves developing models that identify patterns in the data and then apply these insights to forecast outcomes.
Predictive analytics is often linked to descriptive analytics, which focuses on summarizing past data, and prescriptive analytics, which provides recommendations on possible actions.
Essentially, descriptive analytics helps us understand what has happened—it provides the context. Then, based on that context, predictive analytics tries to answer the question of what is likely to happen next. Finally, prescriptive analytics guides us on how to take action in order to optimize those potential outcomes.
Key Components of Predictive Analytics
The key components that make predictive analytics include the types of data used, the sources from which it’s gathered, as well as the tools and technologies that make the predictions possible.
Structured vs. unstructured data
Predictive analytics relies on both structured and unstructured data. Structured data refers to highly organized, easily searchable data that is typically stored in rows and columns, much like what you would find in a spreadsheet or a traditional database. This type of data is neat and easily analyzed using standard techniques and tools. Some examples of such data would be customer records, sales numbers, and inventory data.
Unstructured data is much more varied and complex, including text, images, audio, videos, and even social media posts. This data is not as easily analyzed because it doesn’t fit neatly into traditional rows and columns. It necessitates more advanced techniques, such as text mining or image recognition. However, it is generally also much richer in information.
There is also semi-structured data—the middle ground between structured and unstructured data. This type doesn’t fit into those neat rows and columns we see with structured data, but it still has a level of organization that makes it more manageable than completely unstructured data.
Internal vs. external data sources
By incorporating data from both internal and external sources, predictive analytics models become more comprehensive and accurate. The combination allows organizations to see the full picture as they make predictions.
Internal data sources include anything generated within an organization, such as company databases, customer purchase histories, transaction records, and employee information. On the other hand, external ones come from outside the organization. These might include data from social media platforms, market research reports, industry benchmarks, or economic indicators.
Tools and technologies
What makes it possible for predictive analytics to work with all sorts of data from different sources is the tools and technologies used. Some of the most commonly used tools include machine learning algorithms, data mining techniques, and statistical models, all of which help analyze data and generate predictions.
Platforms like SAS, IBM Watson, Google Cloud AI, and Microsoft Azure ML allow analysts to analyze large datasets and create models that forecast future outcomes. They rely on sophisticated algorithms to work with vast amounts of data to find patterns and insights.
Additionally, programming languages like Python and R, along with TensorFlow, Scikit-learn, or some other libraries, offer flexible and cost-effective solutions for building and deploying predictive models.
Types of Predictive Analytical Models
Various types of predictive analytical models handle different kinds of data and predictive tasks, allowing businesses and organizations to choose the approach that best fits their particular needs.

Classification models
Classification models are designed to sort data into predefined categories or groups. They are particularly useful when you need to determine which category a new data point belongs to based on patterns observed in the existing data. Think of it like sorting emails into “spam” or “not spam” folders or deciding whether a loan application should be approved.
Some common classification models include:
- Decision trees: They split data into smaller groups by asking yes/no questions, like a flowchart.
- Random forest: It combines many decision trees to make predictions, improving accuracy.
- Support vector machines (SVM): SVMs find the best line or boundary that separates different groups of data.
- Neural networks: These models use layers of connected nodes.
Regression models
Regression models predict continuous values. Instead of categorizing data, these models estimate a specific value.
Some examples of regression models are:
- Linear regression: It predicts a number based on the relationship between two variables, like predicting house prices based on square footage.
- Logistic regression: It helps classify data into two groups, like yes/no or true/false, and can also predict the likelihood of something happening.
- Ridge regression: It’s like linear regression but with an extra step to prevent overfitting.
Time-series models
Time-series models are specifically designed to help predict future values based on past trends. These models are particularly useful for forecasting things like demand, sales cycles, or weather patterns.
Some common time-series models include:
- ARIMA (AutoRegressive Integrated Moving Average): This method looks at past data points to predict future ones, combining patterns from previous values and averages.
- Exponential smoothing: It focuses more on recent data when making predictions, which is helpful for forecasting trends that change over time.
- LSTM networks (Long Short-Term Memory): These are a type of neural network that is great for predicting sequences or trends, especially when the data has a pattern over time.
Clustering models
Clustering models group similar data points together. For example, businesses often use clustering models to group customers based on shared behaviors or preferences.
Popular clustering models include:
- K-means clustering: This method divides data into a fixed number of clusters based on similarity.
- Hierarchical clustering: Builds a tree-like structure that shows how clusters relate to one another, helping to understand their connections.
- DBSCAN (Density-Based Spatial Clustering of Applications with Noise): This algorithm groups data based on density and is especially helpful when working with noisy data or outliers.
Anomaly detection models
Anomaly detection models are used to spot unusual patterns in the data—often to flag issues like fraud or cybersecurity threats. These models focus on identifying data points that deviate from a set norm.
Examples of anomaly detection models include:
- Isolation forest: This model isolates anomalies by selecting features randomly and creating decision trees to separate outliers.
- One-class SVM: A variation of the Support Vector Machine, this model learns the boundaries of normal data and flags anything outside of that as an anomaly.
- Autoencoders: A type of neural network, autoencoders compress and then reconstruct data, where large reconstruction errors can indicate an anomaly.
Ensemble models
Ensemble models combine multiple individual models to improve their overall performance and reduce errors.
Ensemble models include:
- Random forest (Bagging): This method uses multiple decision trees to make predictions, which helps make the results more reliable and less likely to be wrong.
- Gradient boosting machines (Boosting): It creates a series of models that each try to fix the mistakes made by the one before, making predictions more accurate over time.
- Stacking models: This technique combines multiple models by using a higher-level model to determine the best way to combine their predictions.
Benefits of Predictive Analytics
Predictive analytics has become part of mainstream business. By using data to forecast future trends, companies gain the needed insights to benefit from:

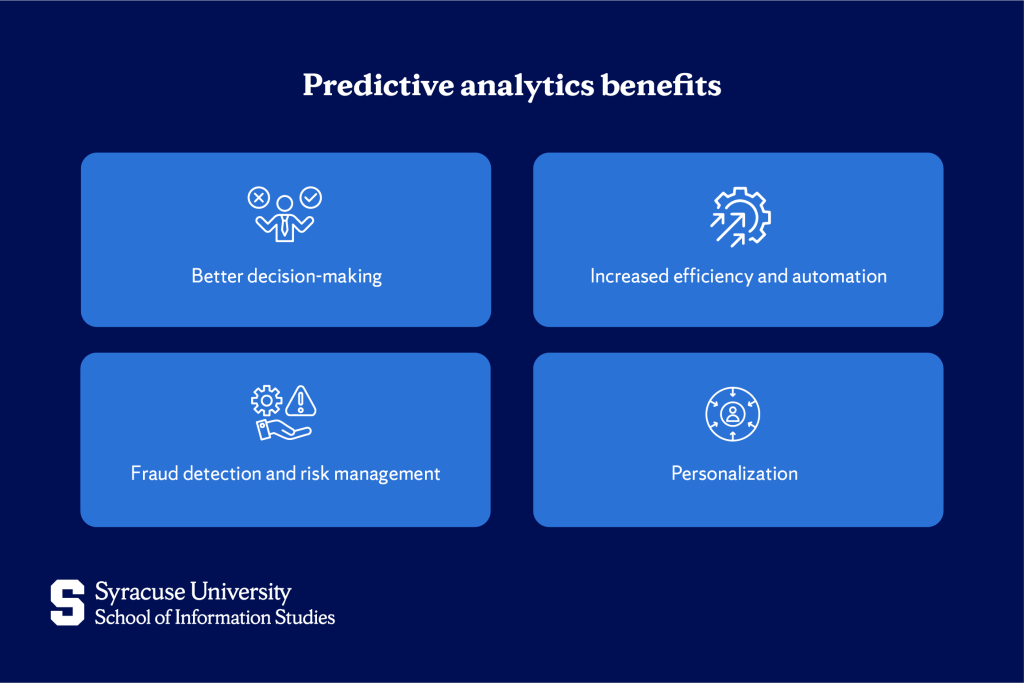
Better decision-making
Through predictive analytics, businesses improve their decision-making process. For example, e-commerce companies can make informed decisions about their inventory by predicting which products are likely to be in demand.
Increased efficiency and automation
Predictive analytics also drives operational efficiency by automating processes. An example of this is the rise of AI-driven customer service chatbots, which rely on predictive models to respond to customer inquiries.
Fraud detection and risk management
Predictive analytics helps businesses detect cases of fraud and also to mitigate risks. If a customer suddenly makes an international purchase, the system flags it as suspicious to help prevent potential fraud.
Personalization
Predictive analytics are widely used in order to personalize customer experiences. Netflix, for example, uses predictive algorithms and data from a user’s viewing history to recommend movies and shows.
Applications of Predictive Analytics in Various Industries
Predictive analytics is now widely used across industries. Making decisions without predictive analytics is difficult and especially unwise—with so much data available that can provide valuable insights.
Some of the sectors that are leveraging this technology include:
- Marketing: Targeting ads, predicting buyers, and identifying valuable leads.
- Retail: Personalizing recommendations, timing promotions, and optimizing inventory.
- Manufacturing: Predicting failures, reducing shipping costs, and improving production decisions.
- Finance: Detecting fraud, approving loans, predicting churn, and managing credit risk.
- Healthcare: Improving care, predicting no-shows, and detecting fraud.
Challenges and Limitations of Predictive Analytics
While predictive analytics provides countless benefits, it should be used carefully as there can be potential risks and challenges. The quality of data used, for example, can present a problem since if the data is inaccurate or incomplete, the predictions made will likely be that way, too.
This ties into another concern: bias in models. If the data used to train a model contains biases, then those biases can carry over into the predictions. This can lead to unfair or harmful outcomes, which can be especially problematic in areas like hiring, lending, or law enforcement.
Another challenge is overfitting. Overfitting happens when a model is so finely tuned to the specific data it’s been trained on that it performs well in controlled tests but struggles when faced with real-world, unseen data. It’s a bit like memorizing answers for a test without truly understanding the material—what works in one scenario might fail in another.
Then, there are ethical concerns and privacy risks. Predictive analytics often uses personal data, and it’s important to handle this information responsibly. Laws like the General Data Protection Regulation (GDPR) set guidelines to protect individuals’ privacy. Failing to comply with such regulations can lead to both legal trouble and serious damage to a company’s reputation.
Turning Predictive Insights into Actionable Strategies
While the challenges and risks associated with predictive analytics can seem daunting, they can be avoided if those behind predictive models are well-trained and knowledgeable in data.
The most reliable way to learn about and gain expertise in working with data is through education. At Syracuse University’s School of Information Studies, our Applied Data Analytics Bachelor’s Degree program can equip students with a thorough understanding of data—how to approach it and how to apply analytical methods to solve problems.
Based on our historical data on student success, if you join us and commit to the program, you’ll be well on your way to achieving success!
Frequently Asked Questions (FAQs)
How does predictive analytics differ from AI and machine learning?
Predictive analytics focuses on forecasting future events, while AI and machine learning focus on enabling systems to learn and make decisions on their own.
What skills are needed to work in predictive analytics?
Some key skills include data analysis, statistical modeling, programming (particularly in languages like Python or R), and a strong understanding of machine learning algorithms and data visualization techniques.
