
Key Takeaways
- Data analytics involves examining large datasets to uncover insights, patterns, and conclusions.
- It is important because it helps businesses make informed decisions regarding their strategies, resource allocation, and customer demands.
- Data analytics includes four main types: descriptive, diagnostic, predictive, and prescriptive analytics.
“Data analytics” has become a buzzword in countless industries. It’s generally said to be used to drive smarter decisions and innovations, but have you ever stopped to actually ponder the term and the question, “What is data analytics”?
It’s a field that’s becoming increasingly important, yet many people aren’t fully aware of its role or how it fits into the bigger picture of business and technology. Regardless of whether you’re considering a career in this field or just are curious about how data-driven decisions work, understanding data analytics can give you a deeper appreciation of how companies use data to tackle challenges in ways that weren’t possible before.
What Is Data Analytics?
Data analytics is essentially a thorough process where large amounts of data are examined to extract useful information, find patterns, and draw conclusions. It’s vital for businesses that want to make informed decisions based on the data related to their products, services, and overall business.
Types of Data Analytics
Data analytics is usually divided into four main types based on their purpose and the angle from which they look at data. These types are:
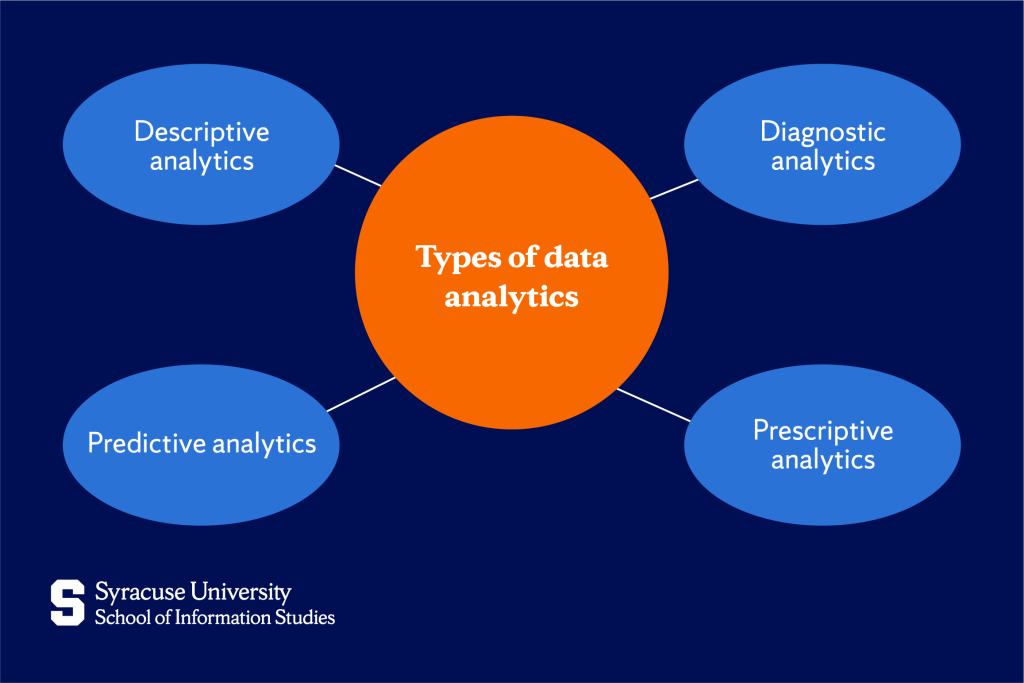
Descriptive analytics
Descriptive analytics is the most basic form of data analysis. To put it simply, it focuses on understanding what has happened. This type of analytics is used to summarize past data in order to help businesses make sense of trends, patterns, and behaviors.
For example, a company might use descriptive analytics to look at last month’s sales figures and then compare them to previous months to see if there’s been growth or decline. Tools like dashboards, trend graphs, and reports are often used in this type of analysis.
While descriptive analytics is definitely important, it only tells part of the story. It isn’t concerned with why or how certain trends occurred, only whether or not they did.
Diagnostic analytics
Diagnostic analytics takes it a step further than descriptive analytics. While the previous one answers what happened, diagnostic analytics seeks to answer why it happened. Therefore, a more detailed investigation into the data is required to identify causes and relationships.
If a company notices a sudden drop in sales, for instance, this type of data analytics would help them find the reasons behind it. Techniques like correlation analysis and root cause analysis are usually used to uncover the underlying issues or factors that contributed to the outcomes.
Diagnostic analytics requires a deeper understanding of the data and its relationships, making it more complex but, at the same time, also more insightful for business leaders.
Predictive analytics
Predictive analytics moves even further as instead of solely examining past data, it focuses on forecasting future events or behaviors. By utilizing historical data and identifying patterns, this type of data analytics uses statistical models and machine learning algorithms to predict what is likely to happen. It helps businesses make informed decisions about the future, from predicting sales trends to anticipating customer behavior.
A retail company could use this type of analytics to forecast which products will be in demand during the upcoming holiday season. Analyzing past purchasing trends can help make better stock decisions and ensure popular items are readily available.
While predictive analytics can certainly provide valuable insights, its effectiveness depends largely on the quality of the historical data being used. Additionally, it doesn’t account for unforeseen changes that might affect the predictions.
Prescriptive analytics
Prescriptive analytics uses the insights gained to recommend what should be done to achieve desired outcomes. It uses algorithms, simulations, and optimization models to suggest actions that can help businesses reach their goals. This type of analysis answers not just “what is likely to happen” but “what actions should be taken” to influence those outcomes.
If predictive analytics shows a drop in sales is likely to occur, prescriptive analytics could recommend actions like launching a targeted marketing campaign or offering discounts on certain products to boost sales.
Prescriptive analytics is definitely one of the most complex forms of analysis, as it requires understanding multiple variables and their potential outcomes. However, it provides businesses with concrete recommendations for optimizing strategies.
Why Is Data Analytics Important?
There are many reasons why data analytics is important, but arguably, the main one is because it helps businesses understand their customers better. By looking at data from things like customer purchases or online behavior, companies can use data analytics to figure out what people want and then adjust their products or services to meet those needs. This, naturally, should lead to more satisfied customers and, consequently, more sales.
Data analytics also enables businesses to make smarter decisions. Instead of guessing what might work, companies can make use of facts and data to guide their strategies. This helps them avoid wasting money on things that don’t work and allows them to focus on what actually helps them grow. However, on this note, it’s important to keep in mind that data isn’t perfect, and if it’s not collected or analyzed correctly, it can lead to mistakes.
In addition to all that, data analytics also helps businesses find new opportunities by showing them what’s missing in the market or what customers need. By using data to track how products are doing and keeping an eye on competitors, businesses can stay competitive and adjust quickly to meet changing customer demands.
How Does Data Analytics Work?
Though data analytics is often considered a process itself, it encompasses many steps that experts need to understand to make sense of the information and guide decision-making. These steps include:
- Data collection: Data is gathered from various sources like surveys, customer relationship management (CRM) systems, or even Internet of Things (IoT) devices.
- Data cleaning: The data is cleaned to remove any errors, duplicates, or incomplete information
- Data analysis: Techniques like statistical modeling, machine learning, or even AI-based tools are applied to make sense of the data.
- Visualization and interpretation: The results are presented through easy-to-understand charts, graphs, and dashboards.
Tools and technologies
For beginners, Excel is one of the most widely used tools for basic data analysis and creating simple charts and graphs. Tableau is another great beginner-friendly option that enables users to create visually appealing data visualizations without needing to write code. Many also use Google Data Studio to create dashboards and reports.
On the more advanced side, Python and R are among the most commonly used programming languages for complex data analysis, machine learning, and automating data processes, with the latter tailored specifically for statistics and data visualization. When experts in data analytics have to deal with big data, they also employ Hadoop— a framework that can handle large datasets.
Applications of Data Analytics
Data analytics has become a must-have tool across various industries. This is because they all can benefit from help in making informed decisions and optimizing their operations.
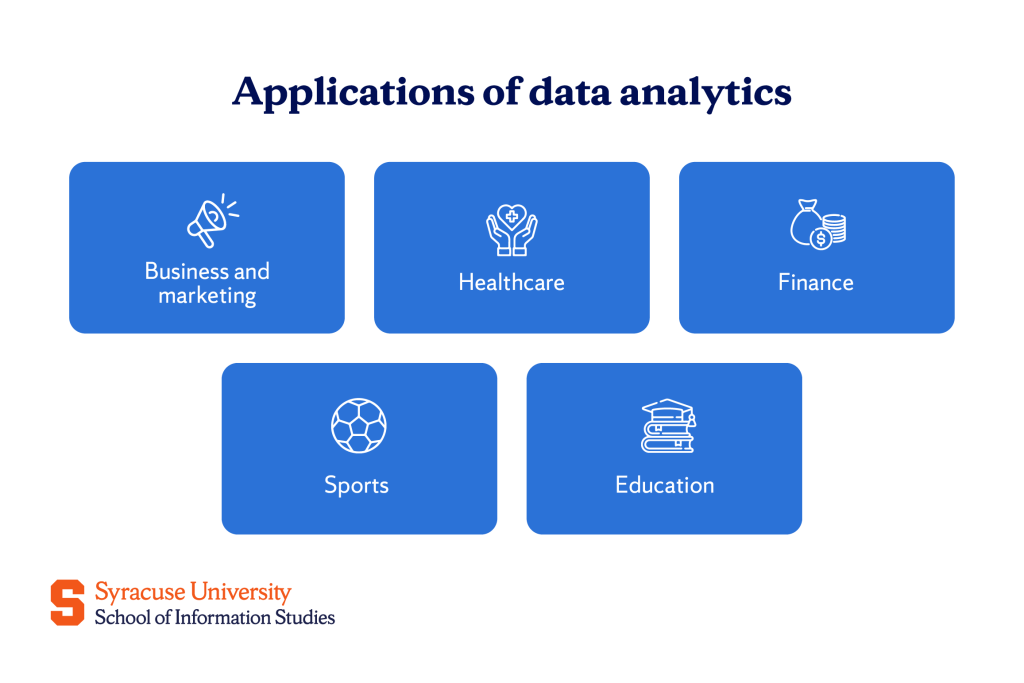
The versatility of data analytics is evident from its application in:
- Business and marketing. Data analytics enables businesses to segment customers based on behaviors, preferences, and demographics, which is used for personalized marketing strategies. It also tracks the performance of marketing campaigns to identify which channels deliver the highest ROI (return on investment) so companies can improve resource allocation.
- Healthcare. Data analytics can be used to identify at-risk individuals. It also helps with optimizing resource allocation, which can, in turn, improve patient care and reduce costs.
- Finance. Here, data analytics is used for fraud detection. Anomaly detection techniques help identify unusual transactions that may indicate fraudulent activity. Data analytics is also used for risk assessment and algorithmic trading.
- Sports. Analyzing player performance data helps optimize training and enhance individual and team performance. It also assists coaches and analysts in developing game strategies by identifying patterns in the opposing team’s play.
- Education. Data analytics enables personalized learning paths for students based on their strengths and weaknesses. It also helps measure educational outcomes, which can guide curriculum and instructional strategies.
Challenges in Data Analytics
Although there are many benefits to incorporating data analytics into a business or organization of any sort, there are also challenges that may arise that data experts must deal with in order to reap the benefits. Understanding these potential obstacles is an important step in learning how to overcome them.
Data privacy and security
As businesses collect more data, especially personal or financial details, they must comply with regulations like the General Data Protection Regulation (GDPR) and implement strong security measures to protect against data breaches. Ensuring data privacy and security is a big challenge, as failure to achieve it can lead to legal issues, loss of customer trust, and financial penalties.
Data quality issues
Poor data quality—such as missing, inconsistent, or outdated data—can lead to inaccurate insights. Therefore, companies must invest time and resources into cleaning and validating data to ensure its reliability and avoid misguided decisions.
Skill gaps
There seems to be a general data skills gap. Although there is a high demand for data analysts and data scientists, there is still a shortfall of individuals with data and analytics competency. So, organizations may need to invest in training or hiring external experts to fill these skill gaps, which can be time-consuming and costly—presenting a new challenge in itself.
The Bottom Line
By using the type of data analytics that aligns with what they want to learn from their data, organizations can make smarter, more informed decisions, whether it be related to improving customer experience, supply chains, or forecasting future demand.
At Syracuse University’s iSchool, we offer an Applied Data Analytics Bachelor’s Degree that will equip you with the skills and practical knowledge required to join the data analytics field. But our commitment doesn’t end there—we’re here to support your growth with our Applied Data Science Master’s Degree, a program that will provide you with advanced knowledge to advance in your career.
Our world is powered by data, so join us and learn how to benefit from it!
Frequently Asked Questions (FAQs):
What are the key skills required for data analytics?
Some key skills for data analytics include proficiency in tools like Excel or Tableau, a solid understanding of statistics, as well as a general ability to analyze and interpret data.
How long does it take to learn data analytics?
Learning in data analytics is an ongoing process, as new tools and challenges constantly emerge. However, you can enter the field in as little as a few months or take a couple of years, depending on whether you pursue a short course or a full degree program with more time spent mastering advanced tools and techniques.
What is the difference between data analytics and data science?
Data analytics focuses on interpreting past data to inform decision-making, while data science aims to predict future trends and develop data-driven models.