
Key Takeaways
- The five core attributes of big data are volume, velocity, variety, veracity, and value (with variability often considered as a sixth).
- Big data systems collect data from many sources, store it in distributed architectures, process and clean it for analysis, and then analyze it to gain insights and take action.
- Big data analytics enables better decision-making, improved efficiency, personalized customer experiences, innovation, and real-time responsiveness across industries.
Success in today’s market isn’t just about having the best product or the lowest price. Those things still matter, but they’re no longer enough on their own. The companies leading the way are the ones that know more, know it sooner, and react more quickly than their competitors.
They do this by relying on something less visible but increasingly powerful: data. Massive amounts of it—what we now call big data.
What Is Big Data?
Big data refers to large and complex datasets. They are so massive and varied that traditional data processing tools, like relational databases or spreadsheets, cannot effectively manage or analyze them.
To understand what this means in practice, imagine the constant stream of information generated every second: social media platforms like X produce millions of posts and interactions, IoT sensors feed continuous data from machinery and infrastructure, video platforms receive hours of footage every minute, and E-commerce sites track customer behavior across thousands of users at once.
Traditional data, like what you’d find in an Excel file or a simple SQL database, is structured, comes in relatively small sizes (megabytes or gigabytes), and can be processed by a single machine. Big data, on the other hand, often spans petabytes or more, distributed across networks of machines. It also includes different types of data, some of which require more advanced systems and distributed computing to make sense of it.
Big data encompasses three main categories:
- Structured data, which is organized and easy to query, such as rows in a customer database
- Unstructured data, which lacks a fixed format and often includes social media posts, video and audio files, photos, or emails
- Semi-structured data, which sits in between the previous two and often uses formats like JSON or XML that have some structure but not a rigid schema
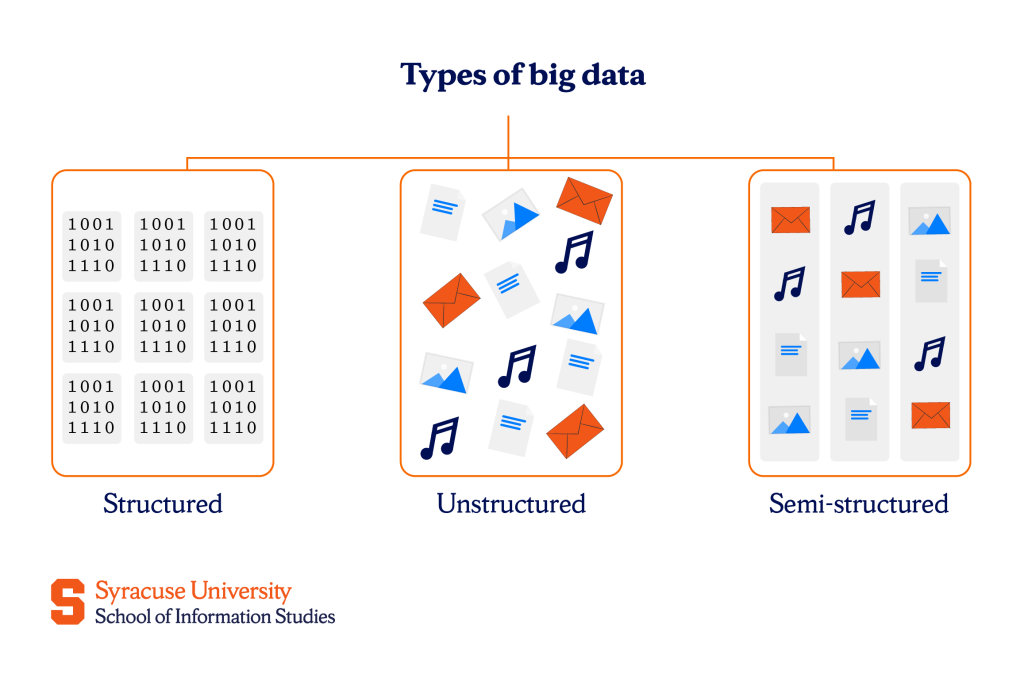
In most real-world scenarios, big data involves a blend of all three. The ability to work across these diverse types is part of what makes big data so powerful and complex.
The 5 Vs of Big Data (And a Bonus One)
To better understand what makes big data unique, experts often describe it using a framework known as the 5 Vs, with a sixth one often added in modern discussions.
Each “V” represents a key characteristic that helps explain what big data is and what challenges come with it.
Volume
Volume is one of the top defining features of big data. In the past, businesses dealt with data measured in megabytes or gigabytes. Now, we’re talking about terabytes, petabytes, or even zettabytes—millions or billions of times larger.
Streaming platforms, for example, like Netflix, store data on every show watched by millions of users every day. Similarly, telecom companies log trillions of phone calls and text messages. That’s volume.
Even a single organization can generate massive amounts of data from websites, customer interactions, emails, and internal operations. The challenge is storing it all and figuring out which pieces are useful.
Velocity
Big data doesn’t just sit around waiting to be collected. It’s constantly flowing in, often in real time. This is what we refer to as velocity. Data is being generated nonstop from many sources: people shopping online, swiping on apps, streaming content, or using connected devices like smartwatches or industrial sensors.
Self-driving cars, for example, rely on big data’s velocity and use the constant flow of data in real time in order to make decisions on the road. The challenge in this case is analyzing data quickly enough to respond in time.
Variety
As mentioned earlier, not all data is the same: some of it is structured and fits neatly into tables, some is semi-structured and follows a loose format, and then there’s unstructured data that doesn’t follow any fixed layout.
Big data brings all these types together, often within the same project. For example, a single marketing campaign might rely on structured data to track customer demographics, semi-structured data to understand user behavior on a website, and unstructured content like online reviews or shared videos to gauge public sentiment.
This mix makes big data incredibly rich in insight, but it also adds layers of complexity when it comes to processing and analyzing it.
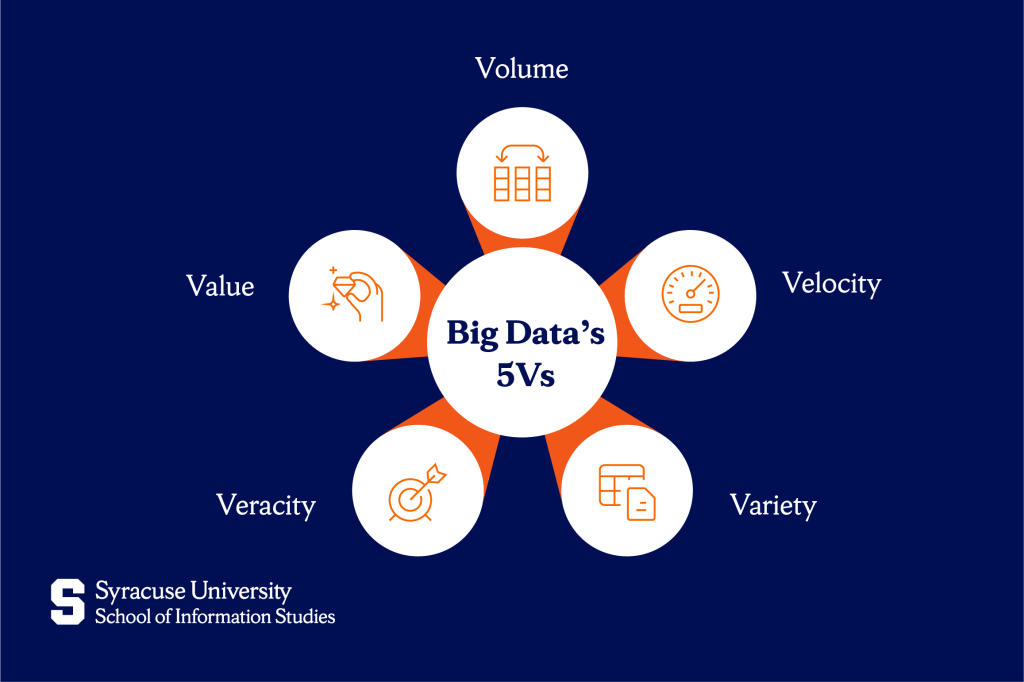
Veracity
When data comes from many sources and at high velocity, there’s always a risk that some of it isn’t accurate. It might be outdated, incomplete, duplicated, or just plain wrong. This is the issue of veracity, or, to put it simply, how trustworthy the data is.
Imagine a weather sensor that malfunctions and sends wrong temperature readings or a social media post that includes sarcasm but gets misinterpreted by an algorithm. Without knowing the data’s quality, it’s easy to come to the wrong conclusions. Because of this, big data systems must include processes to clean and verify the data before it’s used.
Value
The whole purpose of working with data is to gain insights. Volume, speed, variety, and reliability are crucial for big data, but they don’t mean much unless that data can be used to improve decision-making, solve a problem, or provide some other valuable insight.
Therefore, big data also prioritizes value. A retailer might find that certain products sell better together and use that insight to create promotions. This value is found in the ability to turn raw data into smarter choices.
Variability
As a bonus “V,” variability refers to how inconsistent or unpredictable data can be. Sometimes, data behaves differently depending on the situation or context. For example, online conversations might spike suddenly during an event, or a word that means something positive today might mean something negative tomorrow.
This change in context naturally affects how data should be interpreted. A sentiment analysis tool, for instance, needs to understand that the same phrase might carry a different tone depending on who said it, when, and in what setting. Handling this “V” requires flexible tools and algorithms that can adjust to these shifts so the insights can stay relevant and accurate.
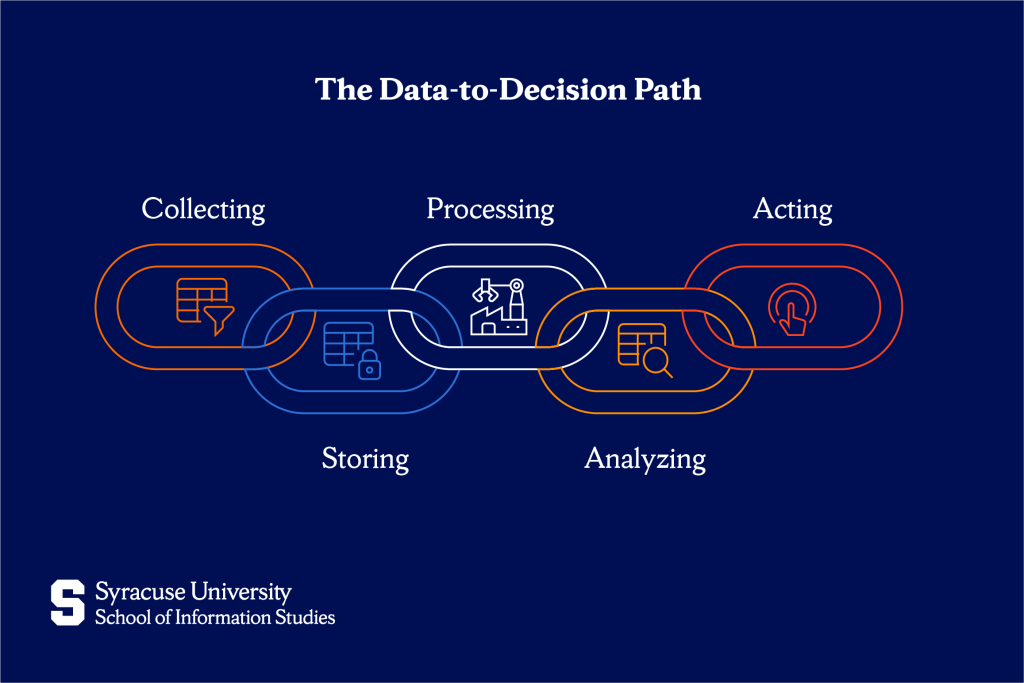
How Big Data Works
Most systems follow five main steps to extract insights from big data: collection, storage, processing, analysis, and action.
1. Collecting
Big data starts with collecting information from many different sources, like websites, mobile apps, social media, machines, or online transactions. Some of this data comes in real time, whereas others might be collected in larger batches. The goal is to bring all this information together in one place for further use.
2. Storing
Once collected, the data needs to be saved so it’s easy to access later. Given the enormous volume of big data, it is often stored in the cloud or across many computers working together. This helps keep things organized and prevents losing data if systems were to fail.
3. Processing
Raw data is quite messy and challenging to work with. It often includes errors, missing pieces, or confusing formats. Processing means cleaning and organizing the data to prepare it for meaningful analysis. This step may include removing duplicates, correcting errors, standardizing formats, merging multiple data sources, or converting unstructured text into numerical values or categories.
4. Analyzing
Analyzing is when we use tools and techniques to find patterns, make predictions, solve problems, and uncover new opportunities. Analysis often involves dashboards, reports, data visualizations, or advanced tools like machine learning models in order to make the information easier to understand and act on.
5. Acting
The final step is taking action based on what the data reveals. This could involve launching a new product, improving an existing service, adjusting prices, or changing a marketing strategy. In some cases, systems are set up to take action automatically, like blocking a suspicious transaction or suggesting something you’re likely to enjoy based on your past behavior.
Benefits of Big Data
Organizations are putting serious resources into big data because, when used well, it can lead to a wide range of advantages, such as:
- Helping make faster, smarter decisions based on actual evidence.
- Lowering costs and improving efficiency by revealing waste, delays, or system issues early on.
- Enabling more personalized customer experiences.
- Accelerating innovation by revealing trends and allowing faster testing and development of new ideas.
- Supporting predictive insights that help prevent problems before they happen.
- Enhancing sustainability efforts by tracking resource use and finding ways to cut emissions and waste.
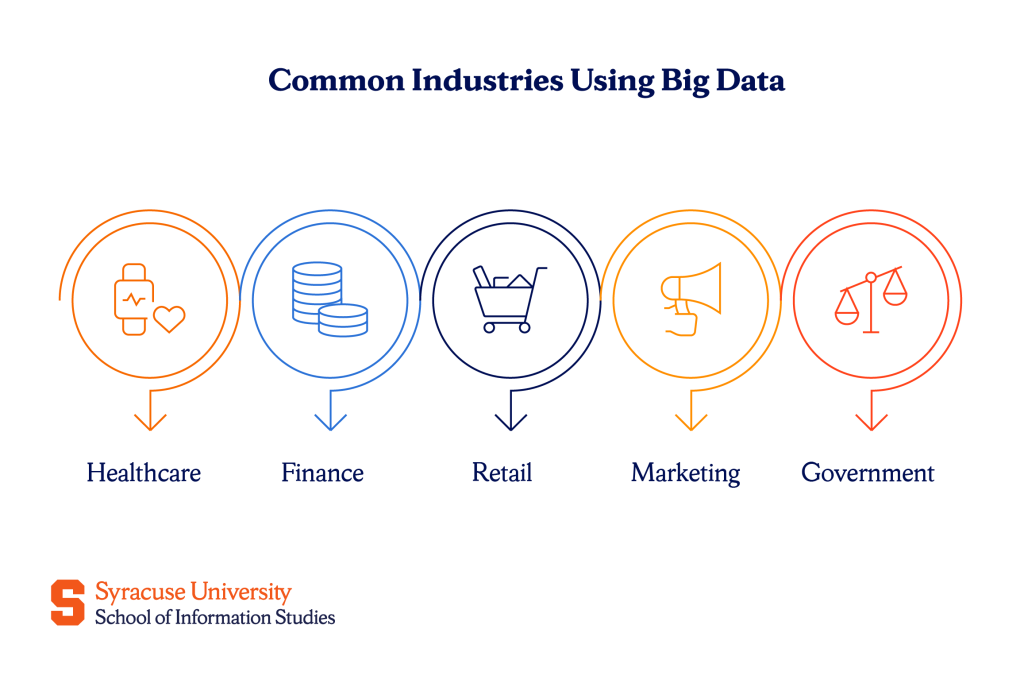
Common Big Data Use Cases
Big data is used across many industries to improve how decisions are made, services are delivered, and problems are solved. Here are some of the most common ways it’s applied:
- In healthcare, big data supports personalized treatments, early disease prediction, faster diagnostics, and more efficient hospital resource planning.
- In finance, it’s used for fraud detection, algorithmic trading, risk management, and more accurate credit scoring.
- In retail, big data helps forecast demand, manage inventory, personalize recommendations, and adjust prices in real time.
- In marketing, it powers precise ad targeting, audience segmentation, real-time campaign tracking, and sentiment analysis from reviews and social media.
- In government, it improves smart city infrastructure, public safety, disaster response, and policy decisions based on real-time and census data.
Big Data Best Practices
To get the most value out of big data and avoid common missteps, organizations should:
- Start with clear business goals so data efforts stay focused and meaningful.
- Set up strong data governance policies to ensure quality and regulatory compliance.
- Choose the right infrastructure based on needs like scale, cost, and data sensitivity.
- Train employees at all levels and build a culture where data is used to guide everyday decisions.
- Use proven big data tools and frameworks instead of trying to build everything from scratch.
- Review and refine data strategies regularly to adapt to changing business needs and new technologies.
Why Big Data Matters More Than Ever
Big data has become something customers expect, teams rely on, stakeholders measure, and organizations depend on to stay competitive. It powers personalized experiences, efficient operations, informed decisions, and long-term planning. What was once cutting-edge is now simply part of doing things well.
As data continues to grow in volume and importance, the ability to interpret and apply it has become a must-have skill across industries. Whether it’s improving services or solving real-world problems, the people who understand data are the ones driving progress.
If you’re looking to build your skills in this area, the iSchool at Syracuse University offers two flexible options: the Master of Applied Data Science for a more thorough experience and the Certificate of Advanced Study in Data Science for those interested in a shorter, practical program that still provides hands-on, practical expertise.
Learn the tools, build your expertise, and move forward in the field of data!
Frequently Asked Questions (FAQs)
What is the difference between big data and data analytics?
Big data refers to large, complex datasets, while data analytics is the process of analyzing any data—big or small—to find useful insights.
How is big data used in machine learning?
Big data provides the large, varied examples machine learning models need in order to recognize patterns, improve over time, and make accurate predictions.
What are the leading big data analytics tools for professionals?
Popular tools include Hadoop, Spark, and Kafka for processing; MongoDB, Redshift, and BigQuery for storage; and Python, R, Tableau, and Power BI for analysis and visualization.