
Key Takeaways
- Data can be classified into qualitative (descriptive) and quantitative (numerical) types, which require different analysis methods.
- Data is also categorized as structured (organized), unstructured (disorganized), or semi-structured (partially organized).
- Some of the most relevant types of big data used in today’s data science processes include transactional, machine, social, and text data.
- The three Vs of big data—Volume, Variety, and Velocity—define the challenges of managing large, diverse, and rapidly generated data.
For some, data is simply another word for information—and while that’s not entirely wrong, there’s a bit more to it. Data refers to raw facts and figures collected through observation, measurement, or experimentation. On its own, it may not mean much. But, when processed, analyzed, and placed in context, that data transforms into something meaningful.
The word itself may be short, but the meaning of data extends across a broad spectrum of information that can be divided into several distinct types. Researchers, analysts, and professionals then use a variety of these types of data to identify patterns, test hypotheses, make predictions, and inform decisions, among other uses.
What Are the Different Types of Data?
Each data type serves a different purpose and requires different methods for analysis and application. Understanding the distinctions is important for all working in data science, statistics, or any other field that relies on data-driven insights.
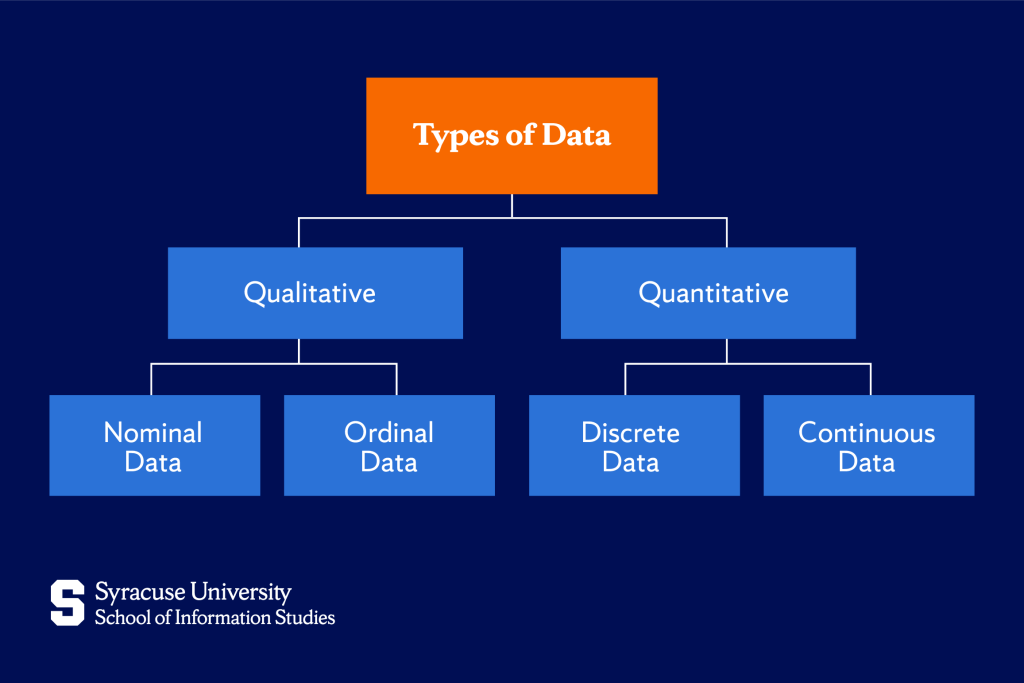
Quantitative data
The term quantitative refers to something that is related to quantities or amounts. So, based on that, data that is classified as quantitative means the information is expressed in numbers—it’s the type of data that we can measure or count.
Such data is all around us—think about how we track our expenses, measure the length of a table, or even count the number of people attending a meeting.
This type of data is mainly used in fields like statistics and research because it helps us analyze and draw conclusions based on measurable information. Quantitative data is divided into two main subcategories: discrete and continuous.
Discrete data
Discrete data consists of countable values. These are often whole numbers and cannot be broken down into smaller parts. For example, if you’re counting the number of students in a classroom or the number of cars in a parking lot, you can’t have a fraction of a student or half a car.
Discrete data answers the “how many” questions—it’s finite and clear-cut.
Continuous data
In contrast, continuous data involves measurements that can take any value within a given range. Think about your height or weight—these can be measured more precisely with decimals, like 5.8 feet or 160.4 pounds.
Unlike discrete data, continuous data can change over time and can be infinitely divided into smaller parts. You can measure it with great precision, and it answers the “how much” or “how tall” type of questions.
Qualitative data
The term qualitative, on the other hand, refers to qualities or characteristics. So, data classified as qualitative is characterized by descriptions.
In contrast to the quantitative type, it’s non-numeric and focuses on specific qualities or characteristics that can be used to categorize things. For example, when describing a favorite color or a person’s nationality, we’re dealing with qualitative data.
This type of data is often categorized into two types: nominal and ordinal.
Nominal data
Nominal data consists of labels or names that don’t have any natural order or ranking. Think about things like your favorite fruit—apple, banana, or cherry. These are just categories that can’t be logically ordered or ranked.
Other examples might include gender or eye color. You can categorize these things, but there’s no inherent ranking between them.
Ordinal data
Ordinal data, however, does have a meaningful order or ranking, but there is no consistent or defined difference between the values. For example, think about a satisfaction survey that asks people to rate something as “poor,” “average,” or “good.” You can rank these from least to most favorable, but the difference between “poor” and “average” isn’t necessarily the same as the difference between “average” and “good.”
This type of data is often used when the exact value doesn’t matter, but the relative position does. Other examples include education levels—”high school,” “bachelor’s,” and “master’s”—which are in clear order but don’t have an exact numeric difference between them.
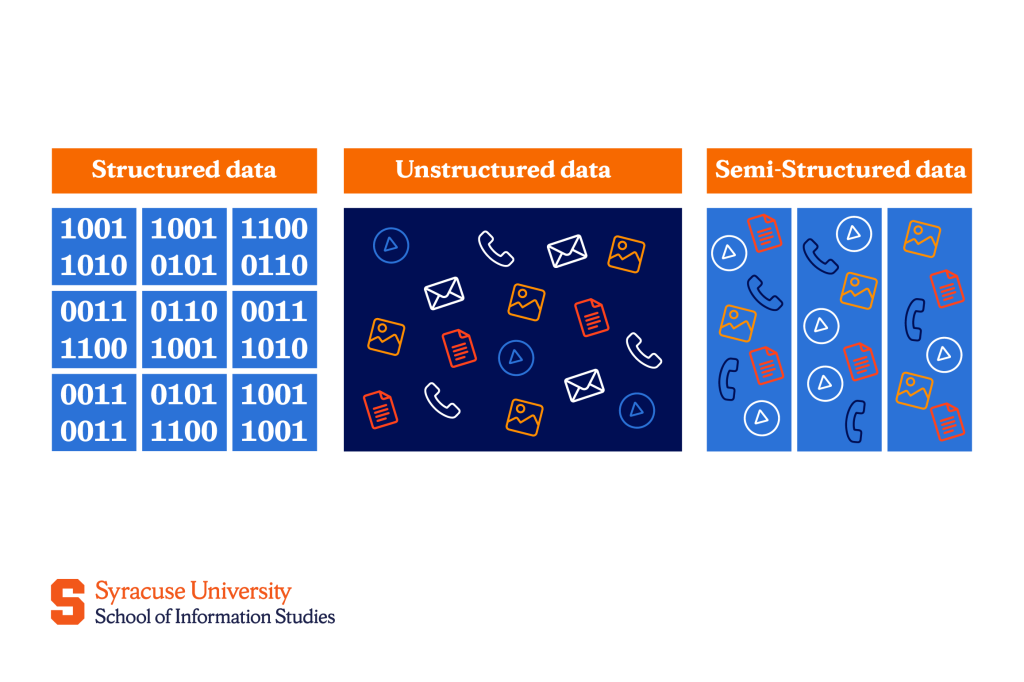
Structured data
Structured data is like a neatly organized spreadsheet where every piece of information is placed into specific rows and columns, much like the way you might organize your list of contacts on your phone or your budget in a table. Because this data is highly organized, it makes it easier to search and manage.
In a database, each entry follows a strict format. For example, if you’re tracking students in a class, each student’s record (like their name, roll number, and marks) will follow the same format.
This type of data is often stored in databases that use a specific schema—a set structure or rules—to ensure consistency. You can think of it like a highly structured filing cabinet where each file (data) has its own labeled folder (attribute) that fits neatly into a well-organized system.
Unstructured data
Unstructured data is the opposite of structured data—it’s more like a messy drawer filled with various items, some of which might be hard to categorize.
Unstructured data includes things like emails, videos, audio files, and customer reviews. These types of data often require more effort to analyze because the information isn’t organized in a predictable way, but it can hold valuable insights when processed properly (like identifying sentiments from social media posts).
Semi-structured data
Semi-structured data is a bit more flexible. It has some organization, but not everything follows a rigid format.
It’s often self-describing, meaning it includes information about the data itself, like an email with a subject line and body text—some emails might have attachments, others might not, but the basic structure (sender, subject, body) is still there. Examples of this kind of data include XML files or JSON files, often used for transmitting data on the web.
Big Data Types and Their Relevance in Data Science
Before the Internet and other connected technologies, organizations collected structured data primarily through internal processes, such as sales transactions and customer records. However, data generation skyrocketed with the expansion of the internet, smartphones, sensors, social media, and other such technologies.
These new technologies enabled the collection of much larger amounts of unstructured data, like social media posts, online reviews, sensor readings, and more. This expansion in data led to the birth of the concept of “big data.”
Some of the most relevant types of big data used in today’s data science processes include:
- Transactional data (e.g., sales records and financial transactions)
- Machine data (e.g., sensor data, server logs, and IoT data)
- Social data (e.g., social media posts and user-generated content)
- Text data (e.g., emails, chat messages, and documents)
The key to understanding big data is the so-called “3Vs” — Volume, Variety, and Velocity.
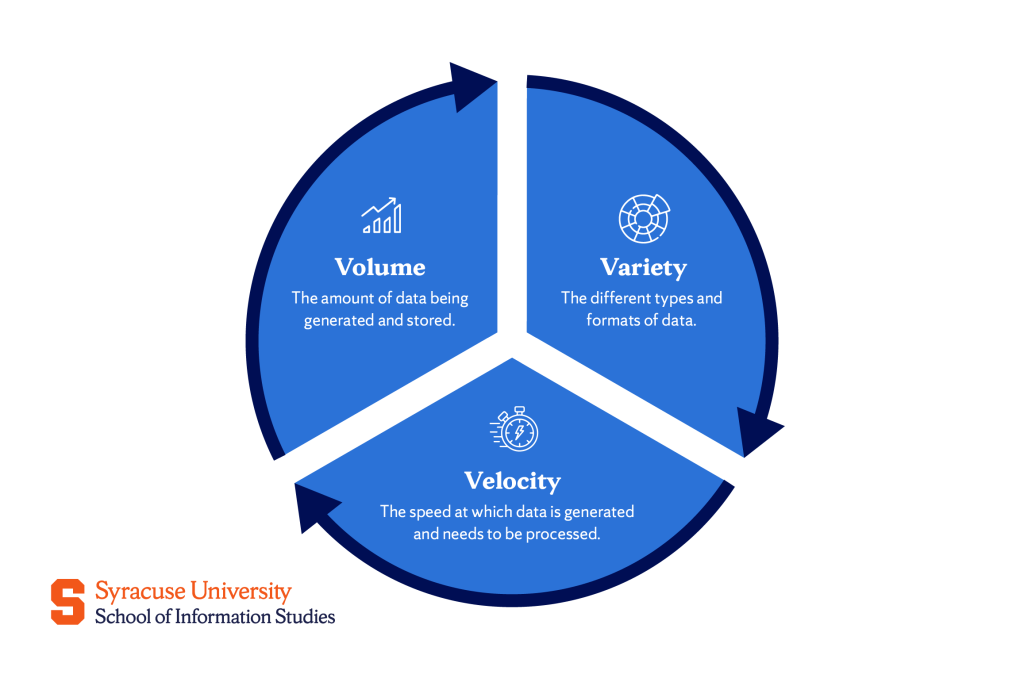
Volume
Volume refers to the large amount of data being generated. Today, the volume of data is growing at an incredible pace, and more data is expected to be produced year after year. This means that companies now need large-scale storage systems capable of handling terabytes (thousands of gigabytes) or even petabytes (millions of gigabytes) of data.
Handling such big amounts of data requires the use of advanced technologies and algorithms specifically designed to manage and analyze large datasets.
Variety
Variety refers to the different data types and formats. While earlier data was mainly numbers or text, today, data can come in a wide array of forms, including pictures, videos, SMS messages, PDFs, audio files, and more.
With data being in so many different formats, professionals in data science must find ways to manage, merge, process, and analyze all the different varieties of data.
Velocity
Velocity refers to the speed at which data is generated and requires processing. In the past, data processing was done in batches, meaning processing large datasets could take hours or even days.
However, with modern technologies, especially in fields like social media, finance, healthcare, and the Internet of Things (IoT), data is generated almost instantly. That’s why it’s important to employ real-time analytics tools that enable immediate processing.
Final Thoughts on Data Classification
For all those working with data, understanding how to classify and organize it is an essential part of knowing how to approach and make sense of complex datasets. Proper classification makes it easier to manage, analyze, and extract meaningful insights.
As Heather Owen, a graduate of Syracuse University School of Information Studies (iSchool), points out:
…people don’t realize how unwieldy data is. Researchers are collecting so much data, and the ability to organize it, manage it, preserve it, and share it with the world is not easy. A lot of researchers weren’t taught how to do it.
That’s why it’s so important for students seeking careers related to data to learn how to properly work with it. They can do so through programs like iSchool’s Applied Data Analytics Bachelor’s Degree or the Applied Data Science Master’s Degree, which aim to equip all its graduates with the skills necessary to acquire, organize, process, and analyze data.
As data continues to grow in both size and complexity, having this foundation in data science and analytics will remain a critical asset in any data-driven profession.
Frequently Asked Questions (FAQs)
Why is it important to categorize data into different types?
Categorizing data is important because it allows us to organize and manage large datasets, making it easier to analyze, retrieve, and ensure accuracy.
How do data types impact data analysis and decision-making?
Data types impact data analysis and decision-making by determining the methods and tools used for analysis. Different data types require different techniques, influencing the insights gained and leading to more accurate, informed decisions.