
Key Takeaways
- The core data science concepts include: project lifecycle, statistics and probability, programming, data preparation, machine learning, and communication.
- Reliable data and sound statistical reasoning are more important than using an advanced machine learning model.
- Beginners should build foundational skills first and introduce machine learning after learning to prepare, analyze, and interpret data.
- Applied projects help learners understand how the concepts connect and prepare them to manage more of the data science lifecycle.
Data science is a broad field that brings together programming, statistics, data analysis, and business problem-solving. Because so many skills and methods contribute to the work, there are also many data science concepts to understand.
For anyone interested in studying or working in the field, learning these concepts provides a clearer sense of how data science works and how its different parts connect.
The Core Data Science Concepts Every Beginner Should Understand
Data science is a field that combines multiple skills and disciplines, but it is often described as a process that begins with a question and ends with information that someone can use. Along the way, data scientists need to understand the data, prepare it for analysis, choose suitable methods, and explain what the results mean.
The following six concepts form the foundation of that work.
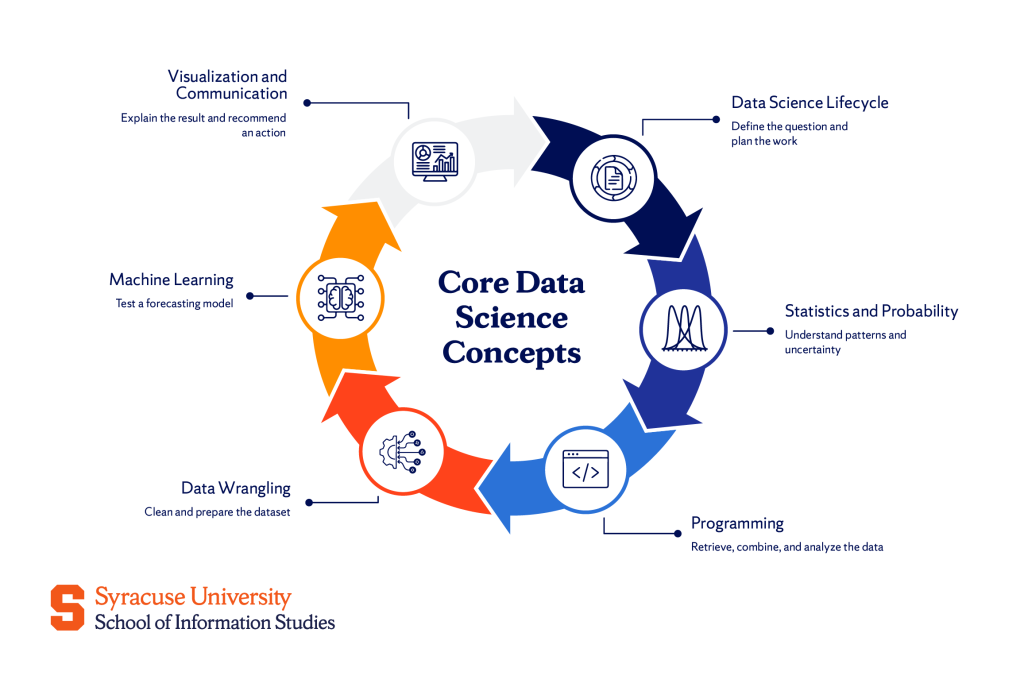
1. The data science lifecycle
The data science lifecycle describes the stages a project moves through. It usually begins with defining the problem, followed by collecting and preparing the necessary data. The data is then analyzed or used to build a model, and the results are evaluated before they are shared or put into use.
The process is rarely completed only once. New information, changing business needs, or poor model performance may require the team to return to an earlier stage.
For example, a retailer trying to forecast holiday demand must first decide what it wants to predict. It then gathers past sales data, checks its quality, tests a forecasting method, and determines whether the results are accurate enough to support inventory decisions.
Frameworks such as CRISP-DM and OSEMN give formal names to these stages. Beginners do not need to memorize every framework immediately, but they should understand that each task belongs to a larger process.
2. Statistics and probability
Statistics helps data scientists understand what the data says. Probability helps them reason about uncertainty and how likely an outcome may be.
Descriptive statistics summarize the information in a dataset. Measures such as the mean, median, range, and standard deviation help show what is typical and how much the values differ.
Inferential statistics goes further. It uses a sample to draw conclusions about a larger group. For example, a company may test a redesigned checkout page on a portion of its customers rather than changing the website for everyone at once.
Statistics also helps data scientists avoid misleading conclusions. Two variables may move together without one causing the other. A result may also appear important even though it could have occurred by chance. Understanding these limits is necessary before recommending a business decision.
3. Programming for data science
Programming allows data scientists to work with datasets that would be too large or complicated to analyze manually. Code is used to retrieve data, correct errors, calculate results, and build models.
Python is widely used because it supports many parts of the data science process. R is also common, particularly in work that has a strong statistical focus. SQL is used to retrieve information stored in relational databases.
Common tools include:
- Pandas and NumPy for working with data in Python
- Scikit-learn for building traditional machine learning models
- Matplotlib and seaborn for creating visualizations in Python
- Dplyr and ggplot2 for data manipulation and visualization in R
- SQL for finding and combining information stored in databases
Beginners do not need to learn every library at once. It is more useful to become comfortable using code to complete a small project, such as combining two datasets or calculating a business metric.
4. Data wrangling and preprocessing
Raw data is rarely ready for analysis. It may contain missing values, repeated records, typing errors, or information stored in inconsistent formats. Data wrangling is the work required to correct these problems and create a usable dataset.
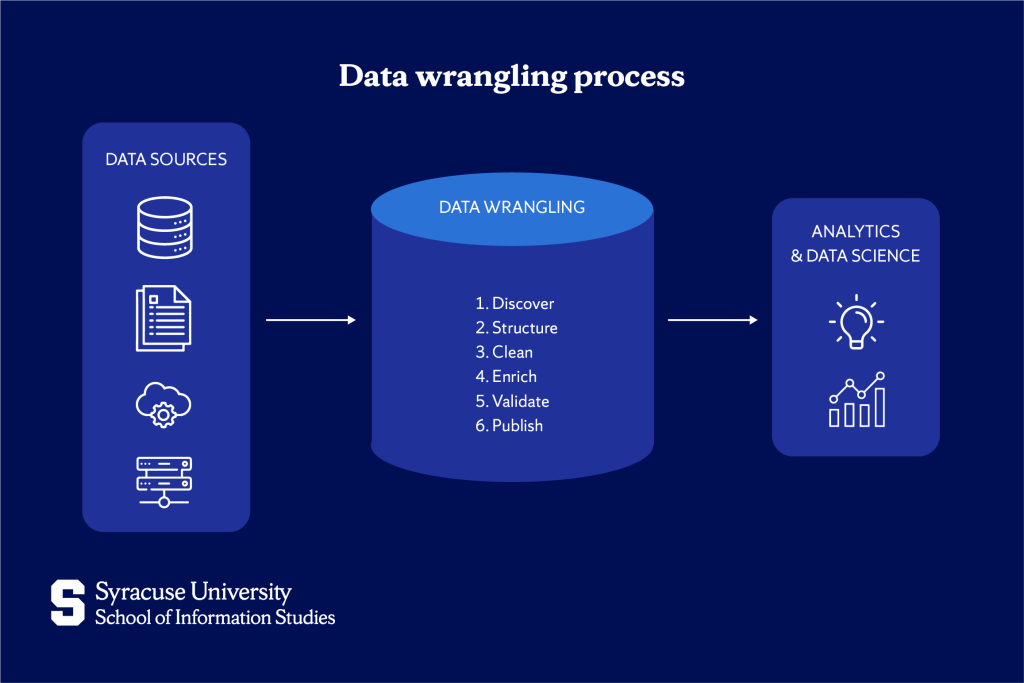
For example, one customer database may record a date as “08/04/2026,” while another records it as “August 4, 2026.” Names may be spelled differently across systems, and some customer records may be incomplete. These inconsistencies must be addressed before the data can be analyzed reliably.
Preprocessing may also involve converting categories into a format a model can use or creating a new variable from existing information. A retailer might calculate total customer spending from several transaction records rather than using each purchase separately.
This stage matters because inaccurate or poorly prepared data can produce misleading results, even when the analysis or model is technically correct.
5. Machine learning
Machine learning allows a computer system to identify patterns in data and use them to make predictions or group similar information. It is one part of data science rather than another name for the entire field.
In supervised learning, the model learns from examples with known answers. A spam filter, for instance, can be trained using emails already labeled as spam or legitimate. In unsupervised learning, the data does not contain predefined answers. The model looks for patterns on its own, such as grouping customers according to similar purchasing behavior.
Beginners also need to understand overfitting. This happens when a model learns the training data too closely and performs poorly on new information. Dividing the data into training and testing sets helps show whether the model has learned a useful pattern or has simply memorized the examples it was given.
The model is only one part of the project. Its value still depends on the quality of the data and whether its results address the original question.
6. Data visualization and communication
Data visualization presents information through charts, graphs, or dashboards. Communication explains what those results mean and why they deserve attention.
The goal is not to create the most detailed chart possible. It is to help the audience understand the main finding without misrepresenting the data. The chart type, labels, scale, and amount of information shown can all affect how a result is interpreted.
Tools such as Tableau and Power BI are commonly used to build dashboards. Data scientists may also create visualizations through Python or R.
For example, a clear trend line may show that sales fall when a product reaches a certain price. The data scientist still needs to explain the limits of that finding and what action the company might consider.
A technically accurate result has little value if decision-makers cannot understand it or do not trust how it was reached.
How to Start Learning These Data Science Concepts
You do not need to master every concept before beginning your first project. Start with the skills needed to complete a simple analysis, then build your knowledge as your projects become more complex. Some topics, particularly statistics and linear algebra, take time to understand, so steady practice matters more than trying to learn everything at once.
A recommended order to follow as you learn these data science concepts is to:
- Start with statistics and probability: It’s the foundation everything else builds on, and it’s the concept most beginners skip and later regret.
- Learn programming languages to work with data: Python or R, and SQL are some of the most common options.
- Practice data wrangling on real, messy datasets: This is the day-to-day job and the fastest way to build intuition.
- Add exploratory data analysis and visualization: Learn to ask questions of data and communicate what you find.
- Layer machine learning last: It’s the most exciting concept but the least useful without the four before it in place.
Why These Concepts Matter for a Data Science Career
These concepts matter because they cover the main stages of a data science project. Employers need people who can understand a problem, work with imperfect data, choose an appropriate method, and explain the result clearly. Knowing only how to build a model is not enough if the data is unreliable or the result does not answer the original question.
They also help data scientists identify where a project has gone wrong. Statistics may reveal that a conclusion is weak, preprocessing may uncover errors in the dataset, and model evaluation may show that a prediction will not perform well on new data. Understanding how the concepts connect makes it easier to solve these problems rather than treating each tool as a separate skill.
As data scientists gain experience, they are often expected to take responsibility for more of the lifecycle. A beginner may focus on cleaning data or producing an analysis, while a more experienced professional may help define the problem, select the method, assess the risks, and present recommendations to decision-makers. A strong foundation in these concepts therefore supports both entry into the field and progression into more independent roles.
Final Reflections on the Core Data Science Concepts
Data science concepts become easier to understand when they are applied to a complete project rather than studied separately. Working with a real question shows how decisions made during data preparation affect the analysis and why the result must be explained in a way others can use.
A structured program provides opportunities to make these connections through guided practice and feedback. Syracuse University’s iSchool offers applied data science study at several levels, including an Applied Data Science Bachelor’s Degree, a minor in Applied Data Science, and an Applied Data Science Master’s Degree available on campus or online. Its project-based approach allows students to develop the core concepts while working with real datasets and problems.
Frequently Asked Questions (FAQs)
What are the 5 C’s of data science?
The most common version includes Capture, Clean, Curate, Compute, and Communicate, which describes the process of collecting data, preparing and organizing it, analyzing it, and presenting the findings.
Do I need to be good at math to learn data science?
You need a working understanding of statistics and probability, along with some linear algebra for machine learning. The required depth depends on the role, and beginners can strengthen their mathematical knowledge as they take on more advanced projects.
What should I learn first in data science?
Start with basic statistics and one programming language, usually Python or R, then learn SQL and data preparation. Once you can clean, explore, and visualize a dataset, move into machine learning and model evaluation.
Is machine learning the same as data science?
No. Machine learning uses algorithms to learn patterns from data, while data science is a broader field that also includes collecting and preparing data, statistical analysis, visualization, and communicating findings. A data science project may use machine learning, but not every project requires it.